. 2014 Jul 1;28(13):1397-409.
doi: 10.1101/gad.241661.114. Epub 2014 Jun 17.

Evolutionally dynamic L1 regulation in embryonic stem cells

Affiliations

Evolutionally dynamic L1 regulation in embryonic stem cells

Nathaly Castro-Diaz et al. Genes Dev. .

Abstract

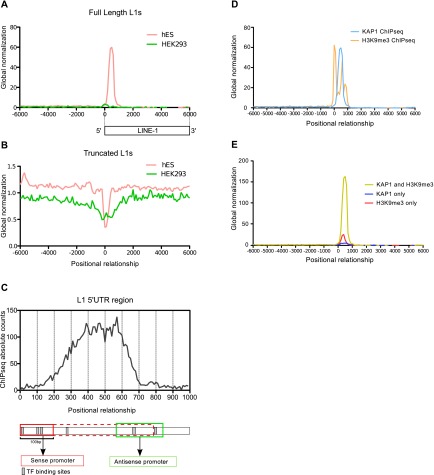
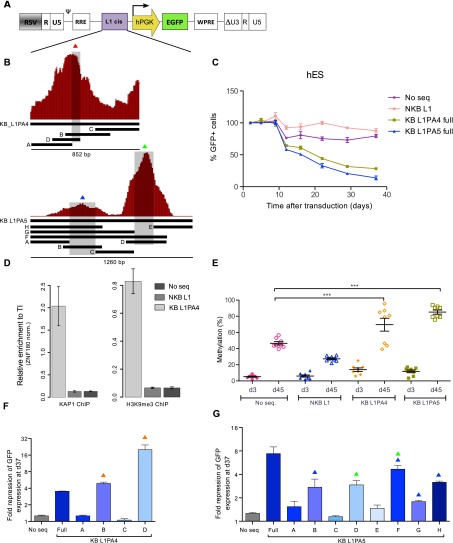
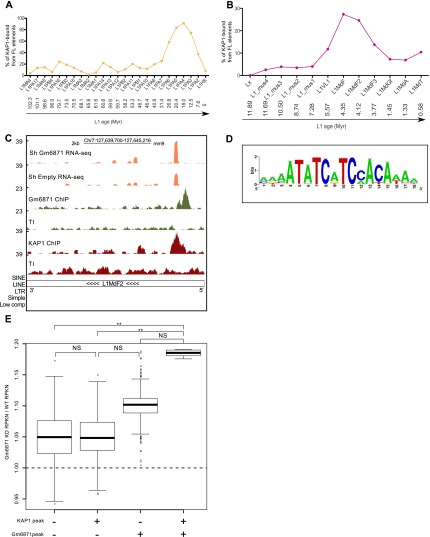
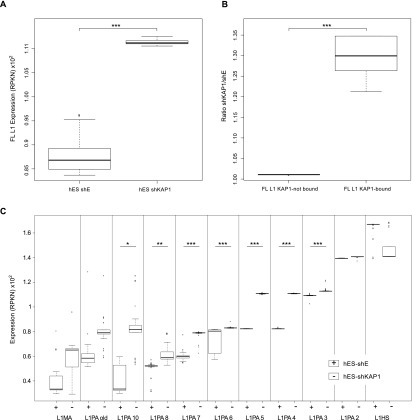
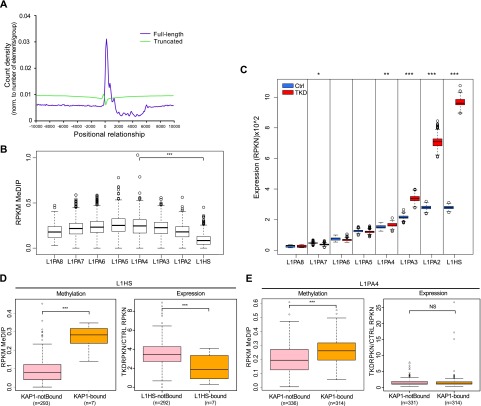
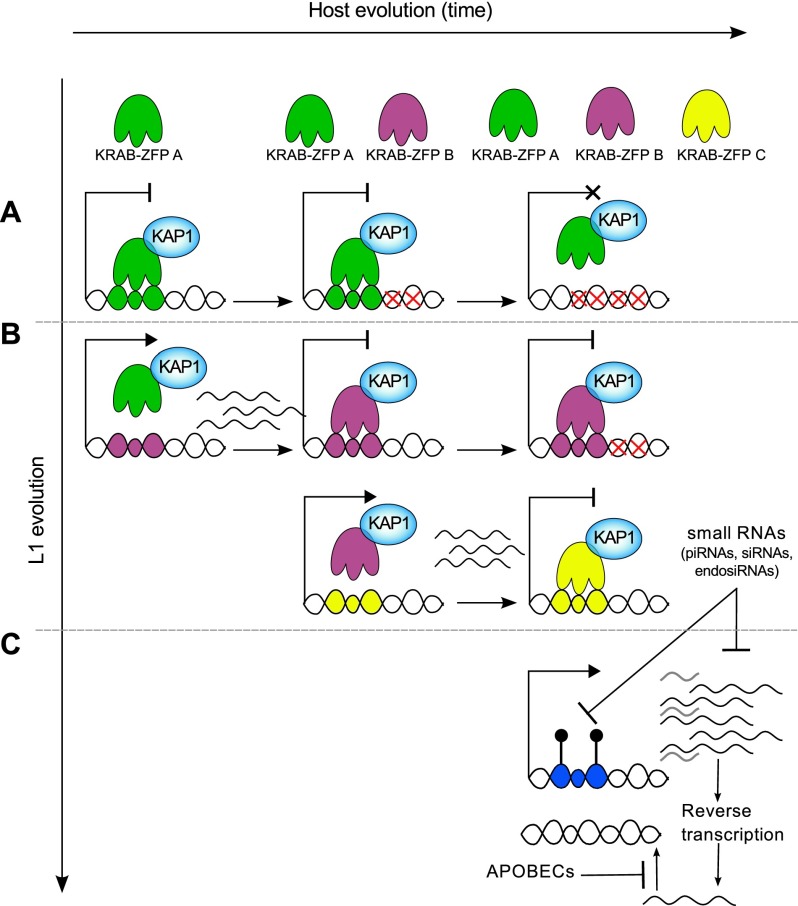
Mobile elements are important evolutionary forces that challenge genomic integrity. Long interspersed element-1 (L1, also known as LINE-1) is the only autonomous transposon still active in the human genome. It displays an unusual pattern of evolution, with, at any given time, a single active L1 lineage amplifying to thousands of copies before getting replaced by a new lineage, likely under pressure of host restriction factors, which act notably by silencing L1 expression during early embryogenesis. Here, we demonstrate that in human embryonic stem (hES) cells, KAP1 (KRAB [Krüppel-associated box domain]-associated protein 1), the master cofactor of KRAB-containing zinc finger proteins (KRAB-ZFPs) previously implicated in the restriction of endogenous retroviruses, represses a discrete subset of L1 lineages predicted to have entered the ancestral genome between 26.8 million and 7.6 million years ago. In mice, we documented a similar chronologically conditioned pattern, albeit with a much contracted time scale. We could further identify an L1-binding KRAB-ZFP, suggesting that this rapidly evolving protein family is more globally responsible for L1 recognition. KAP1 knockdown in hES cells induced the expression of KAP1-bound L1 elements, but their younger, human-specific counterparts (L1Hs) were unaffected. Instead, they were stimulated by depleting DNA methyltransferases, consistent with recent evidence demonstrating that the PIWI-piRNA (PIWI-interacting RNA) pathway regulates L1Hs in hES cells. Altogether, these data indicate that the early embryonic control of L1 is an evolutionarily dynamic process and support a model in which newly emerged lineages are first suppressed by DNA methylation-inducing small RNA-based mechanisms before KAP1-recruiting protein repressors are selected.

Keywords: DNA methylation; KAP1; KRAB-ZFPs; LINE1; embryonic stem cells; evolution.


Figures

Figure 1.
Figure 1.
KAP1 coincides with H3K9me3 at the 5′ end of full-length L1 in hES cells. Distribution of ChIP-seq KAP1 peaks relative to the 5′ end of full-length elements (A) or the center of truncated L1 elements (B) in hES and HEK293 cells. The profiles were normalized to the total number of ChIP-seq peaks for each cell line. (C) KAP1 ChIP-seq peak distribution over the first kilobase of L1. The L1 5′ UTR is schematized below, with sense and antisense promoters as red and green boxes, respectively. Sense promoter is diversely depicted as mainly located in the first 100 bp or extending up to 700 bp. (D) Overlap of KAP1 and H3K9me3 ChIP-seq tags relative to the 5′ end of full-length L1 elements. (E) Relative frequency of KAP1+H3K9me3, KAP1-only, and H3K9me3-only peaks at this location.
Figure 2.
Figure 2.
KAP1-binding L1 fragments can induce repression and DNA methylation of a heterologous promoter in hES. (A) KB (KB L1PA4 and KB L1PA5) and NKB (NKB L1PA4) L1 sequences were cloned in depicted lentiviral vector upstream of a PGK-EGFP expression cassette. The resulting vectors were transduced in hES, and EGFP expression was monitored over time by FACS. (B) Schematic representation of the KAP1 ChIP peaks mapped on the L1PA4 and L1PA5 5′ end, with indication of derived fragments and subfragments cloned in the vector depicted in A. (C) Monitoring of GFP expression in hES cells transduced with the indicated vectors. (No seq) Lentiviral vector with no ERE-derived fragment upstream of the expression cassette. The figure shows the mean and SD of two biological replicates. (D) KAP1 and H3K9me3 recruitment to indicated lentiviral vectors in hES, assessed 35 d after transduction by ChIP-qPCR using PGK-specific primers. The figure illustrates the mean and SD of technical replicates. This experiment was performed twice with similar results (see Supplemental Fig. S3). Relative enrichment was determined by normalizing to a known positive (ZNF180 3′ UTR) control. (E) Influence of the L1 cis-acting sequences on the methylation of the nearby PGK promoter. Methylation of eight CpG positions was evaluated by pyrosequencing at days 4 and 35 after transduction of hES cells with the PGK-GFP lentiviral vectors. Mean and standard error mean (SEM) of two biological replicates is shown. Statistical differences were determined by one-way ANOVA test using the Bonferroni multiple test adjustment. (***) P ≤ 0.001. (F,G) Fold repression of the indicated vectors containing L1 subfragments described in B, assessed 37 d after transduction (respect to day 5). Overtime fold repression is presented in Supplemental Figure S3. Colored triangles indicate the presence of L1 sequences overlapping with the summits of the respective KAP1 ChIP-seq peaks as depicted in B.
Figure 3.
Figure 3.
Evolutionally dynamic and KRAB-ZFP-mediated KAP1–L1 interaction. Percentage of KB full-length (FL) L1 elements per subfamily in hES (A) and mES (B) cells, arranged from the oldest to the youngest subfamily using ages obtained from previously published divergence analysis studies (Khan 2005; Sookdeo et al. 2013). (Myr) Million years. (C) Screenshot of a representative L1MdF2 element, illustrating RNA-seq coverage plots from control (shEmpty) and Gm6871 knockdown mES cells as well as gm6871 and Kap1 ChIP-seq tracks. (D) Putative gm6871 DNA-binding motif identified by computing gm6871 ChIP-seq peaks with the RSAT software (Thomas-Chollier et al. 2012). (E) Relative change in the expression (RPKN [ normalized reads per kilobase]) of murine full-length L1s bound or not bound by KAP1 and/or Gm6871 between Gm6871 knockdown and wild-type mES cells. The raw data were bootstrapped 1000 times with a resampling size of 100 for the plot design. The statistical analyses were calculated on the entire raw data by Wilcoxon nonparametric test. (NS) P > 0.05; (**) P ≤ 0.01.
Figure 4.
Figure 4.
KAP1 depletion leads to up-regulation of KB L1 in hES cells. (A) Comparative expression of full-length L1 elements in hES cells transduced with control (shE) or Kap1 knockdown (shKAP1) lentiviral vectors. (B) Relative change in the expression of full-length L1 elements bound or not by KAP1, comparing Kap1 knockdown and control hES cells. (C) Comparative expression of full-length L1 in control versus Kap1 knockdown hES cells, examining each L1 subfamily separately, arranged from the oldest to the youngest one. The “L1MA” category corresponds to the families L1MA1 to L1MA9. The “L1PA old” category corresponds to the families L1PA11 to L1PA17. The raw data have been bootstrapped 1000 times for the plot design. Expression corresponds to RPKN values (see the Material and Methods), with P-values ([*] P ≤ 0.05; [**] P ≤ 0.01; [***] P ≤ 0.001) calculated on the raw data by Wilcoxon nonparametric test.
Figure 5.
Figure 5.
DNMT depletion induces up-regulation of younger L1 subfamilies. (A) Comparative expression of full-length L1 in control and DNMT knockdown (triple knockdown [TKD]) hES cells, analyzing each subfamily separately as described in Figure 4C. (B) Distribution of MeDIP-seq reads relative to the 5′ end of full-length (pink line) or truncated (yellow line) L1, normalizing profiles to the total number of elements per group. (C) DNA methylation levels on full-length L1 elements separated by subfamilies. (D) DNA methylation levels in full-length L1PA4 and L1Hs bound or not by KAP1 in hES cells, based on the numbers of MeDIP-seq reads per million base pairs per kilobase of L1 (RPKM). (E) Relative change in the expression of the same L1 elements, comparing triple knockdown and control hES cells. P-values ([NS] P > 0.05; [*] P ≤ 0.05; [**] P ≤ 0.01; [***] P ≤ 0.001) were calculated with Wilcoxon nonparametric test.
Figure 6.
Figure 6.
Model for the evolutionally dynamic control of L1. (A) Very ancient L1s (shown in the top row) may have been once recognized by the KRAB/KAP1 system but have since then accumulated mutations (red crosses) abrogating binding by cognate KRAB-ZFPs but also transcription ability. (B) More recent subfamilies recruit KAP1 through sequence-specific KRAB-ZFPs but also may have some mutations taming their baseline expression. (C) The youngest L1 elements are highly transcribed and are not yet recognized by any KRAB-ZFP but produce small RNAs such as piRNAs, which in turn down-regulate their expression via DNA methylation and see their retrotransposition further blocked by proteins such as APOBEC family members.

Comment in

References

    1. Aravin AA, Hannon GJ, Brennecke J 2007. The Piwi–piRNA pathway provides an adaptive defense in the transposon arms race. Science 318: 761–764 - PubMed
    1. Babushok DV, Kazazian HH 2007. Progress in understanding the biology of the human mutagen LINE-1. Hum Mutat 28: 527–539 - PubMed
    1. Barde I, Rauwel B, Marin-Florez RM, Corsinotti A, Laurenti E, Verp S, Offner S, Marquis J, Kapopoulou A, Vanicek J, et al. 2013. A KRAB/KAP1–miRNA cascade regulates erythropoiesis through stage-specific control of mitophagy. Science 340: 350–353 - PMC - PubMed
    1. Beck CR, Garcia-Perez JL, Badge RM, Moran JV 2011. LINE-1 elements in structural variation and disease. Annu Rev Genomics Hum Genet 12: 187–215 - PMC - PubMed
    1. Bernstein BE, Stamatoyannopoulos JA, Costello JF, Ren B, Milosavljevic A, Meissner A, Kellis M, Marra MA, Beaudet AL, Ecker JR, et al. 2010. The NIH Roadmap Epigenomics Mapping Consortium. Nat Biotechnol 28: 1045–1048 - PMC - PubMed

Publication types

Substances

Associated data