. 2014 Jun;197(2):561-72.
doi: 10.1534/genetics.114.164269.

Estimating tempo and mode of Y chromosome turnover: explaining Y chromosome loss with the fragile Y hypothesis

Affiliations

Estimating tempo and mode of Y chromosome turnover: explaining Y chromosome loss with the fragile Y hypothesis

Heath Blackmon et al. Genetics. 2014 Jun.

Abstract

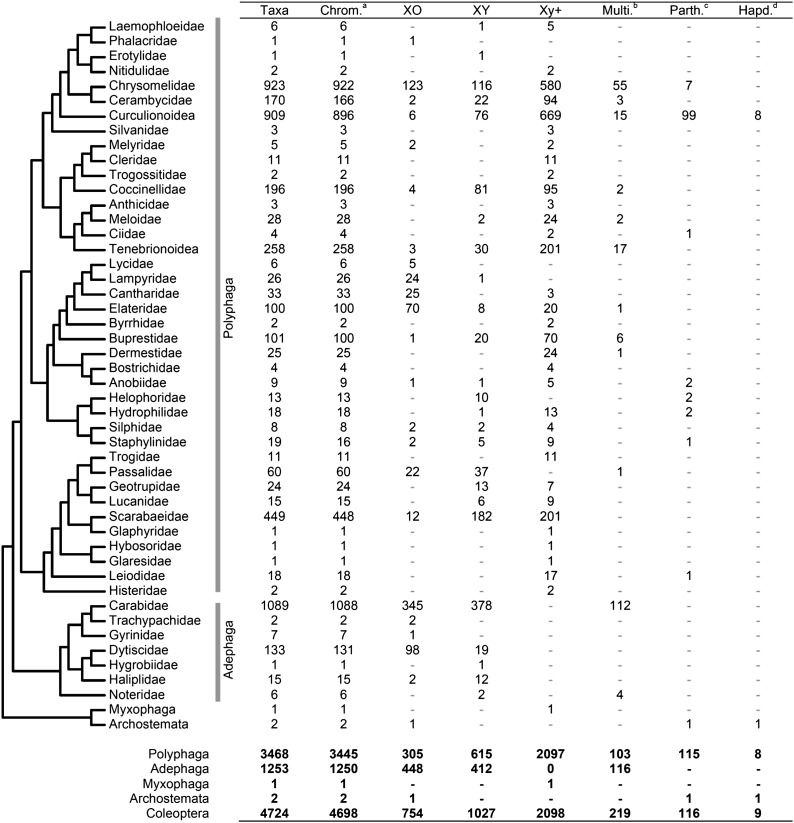
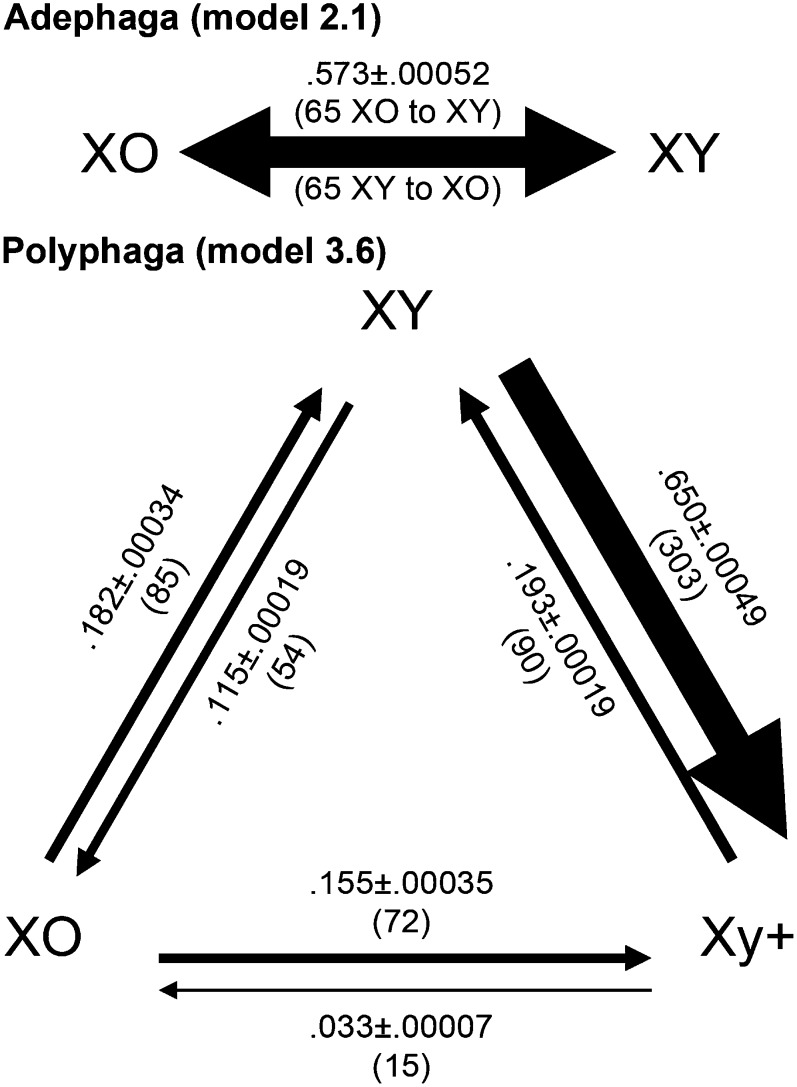
Chromosomal sex determination is phylogenetically widespread, having arisen independently in many lineages. Decades of theoretical work provide predictions about sex chromosome differentiation that are well supported by observations in both XY and ZW systems. However, the phylogenetic scope of previous work gives us a limited understanding of the pace of sex chromosome gain and loss and why Y or W chromosomes are more often lost in some lineages than others, creating XO or ZO systems. To gain phylogenetic breadth we therefore assembled a database of 4724 beetle species' karyotypes and found substantial variation in sex chromosome systems. We used the data to estimate rates of Y chromosome gain and loss across a phylogeny of 1126 taxa estimated from seven genes. Contrary to our initial expectations, we find that highly degenerated Y chromosomes of many members of the suborder Polyphaga are rarely lost, and that cases of Y chromosome loss are strongly associated with chiasmatic segregation during male meiosis. We propose the "fragile Y" hypothesis, that recurrent selection to reduce recombination between the X and Y chromosome leads to the evolution of a small pseudoautosomal region (PAR), which, in taxa that require XY chiasmata for proper segregation during meiosis, increases the probability of aneuploid gamete production, with Y chromosome loss. This hypothesis predicts that taxa that evolve achiasmatic segregation during male meiosis will rarely lose the Y chromosome. We discuss data from mammals, which are consistent with our prediction.

Keywords: Coleoptera; Karyotype; comparative methods; genetics of sex; sex chromosome.


Figures

Figure 1
Figure 1
Taxonomic instability indices based on 500 maximum likelihood tree inferences. The dashed line shows the chosen cutoff, an index of 2194. Most taxa, 93%, fall below this while above this value instability increases quickly.
Figure 2
Figure 2
Models of sex chromosome system transitions. (A) Two-state coding model with taxa partitioned between XO and XY. Using this coding we fit models with one rate (model 2.1) and two rates (model 2.2). (B) Three-state coding model with taxa partitioned between XO, XY, and Xy+. Using this coding we fit models with 1, 2, 4, and 6 rate parameters. Model 3.4 is a constrained model allowing for comparison between two-state and three-state coding in Polyphaga. If XY and Xy+ are equivalent states, models 3.4 and 3.6 should perform equally well.
Figure 3
Figure 3
Cladogram illustrating the available cytogenetic data and distribution of sex chromosome systems in Coleoptera. Number of species in the karyotype database in each sex chromosome (or sex determination) state. Data and references are available at www.uta.edu/karyodb. The footnote symbols represent: athe number of species with chromosome number available; bsex chromosome systems with multiple X and or Y chromosomes; cspecies with parthenogenetic reproduction; and dspecies with haplodiploidy sex determination.
Figure 4
Figure 4
Sex chromosome system transition rate estimates. Rates are reported as the probability of transition per 100 million years ± the standard error. Parentheses indicate the mean number of transitions inferred. In Adephaga the mean number of transitions is the sum of transitions between both states.
Figure 5
Figure 5
Distribution of PPS datasets in the suborder Adephaga. The black lines indicate the density of simulated datasets; the vertical red lines indicate the number of taxa observed in the XY state. (A) Adequate performance of model 2.1 in Adephaga is evident by the concentration of datasets similar to the observed data. The poor performance of model 2.1 in the subtrees composed of the clades Trechitae (B) and Cicindelini + Colyrinae (C) is evidence that these clades have higher retention rates of the Y chromosome than is expected for groups in the suborder Adephaga.
Figure 6
Figure 6
Distribution of PPS datasets in the suborder Polyphaga. Each circle represents a simulation based on the parameter estimates from model 3.6 and are colored to reflect the root state chosen for the simulation. The larger red circle indicates the observed data. Axes represent the percent of terminal taxa in each of the three sex chromosome states. The empirical observation being near the most dense part of the distribution of simulation results indicates that model 3.6 adequately predicts sex chromosome evolution in Polyphaga. The tail of simulations with a high proportion of XO taxa arises in large part from runs where XO was assigned as the root state, which is unlikely to be the true ancestral state in Polyphaga.

References

    1. Aberer A. J., Krompass D., Stamatakis A., 2013. Pruning rogue taxa improves phylogenetic accuracy: an efficient algorithm and webservice. Syst. Biol. 62: 162–166 - PMC - PubMed
    1. Adolfsson S., Ellegren H., 2013. Lack of dosage compensation accompanies the arrested stage of sex chromosome evolution in ostriches. Mol. Biol. Evol. 30: 806–810 - PMC - PubMed
    1. Aitken R. J., Graves J. A. M., 2002. Human spermatozoa: the future of sex. Nature 415: 963. - PubMed
    1. Aradottir G., Angus R., 2004. A chromosomal analysis of some water beetle species recently transferred from Agabus Leach to Ilybius Erichson, with particular reference to the variation in chromosome number shown by I. montanus Stephens (Coleoptera: Dytiscidae). Hereditas 140: 185–192 - PMC - PubMed
    1. Arakawa Y., Nishida-Umehara C., Matsuda Y., Sutou S., Suzuki H., 2002. X-chromosomal localization of mammalian Y-linked genes in two XO species of the Ryukyu spiny rat. Cytogenet. Genome Res. 99: 303–309 - PubMed

Publication types