. 2014 May 22;5(6):1926-40.
doi: 10.1364/BOE.5.001926. eCollection 2014 Jun 1.

Improved noncontact optical sensor for detection of glucose concentration and indication of dehydration level

Affiliations

Improved noncontact optical sensor for detection of glucose concentration and indication of dehydration level

Nisan Ozana et al. Biomed Opt Express. .

Abstract

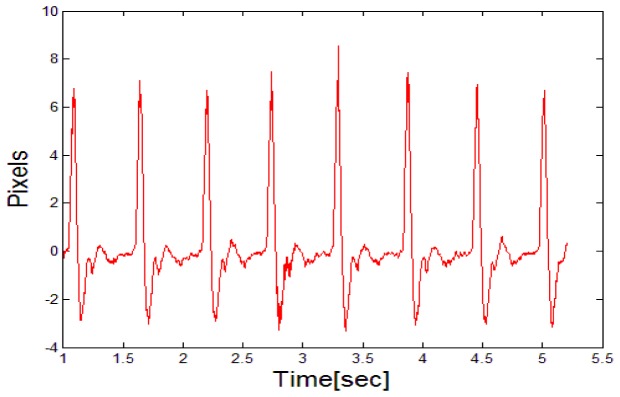
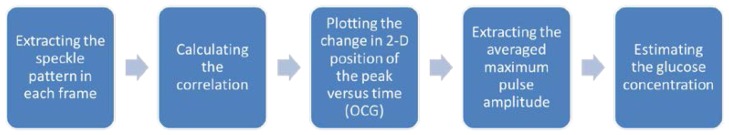
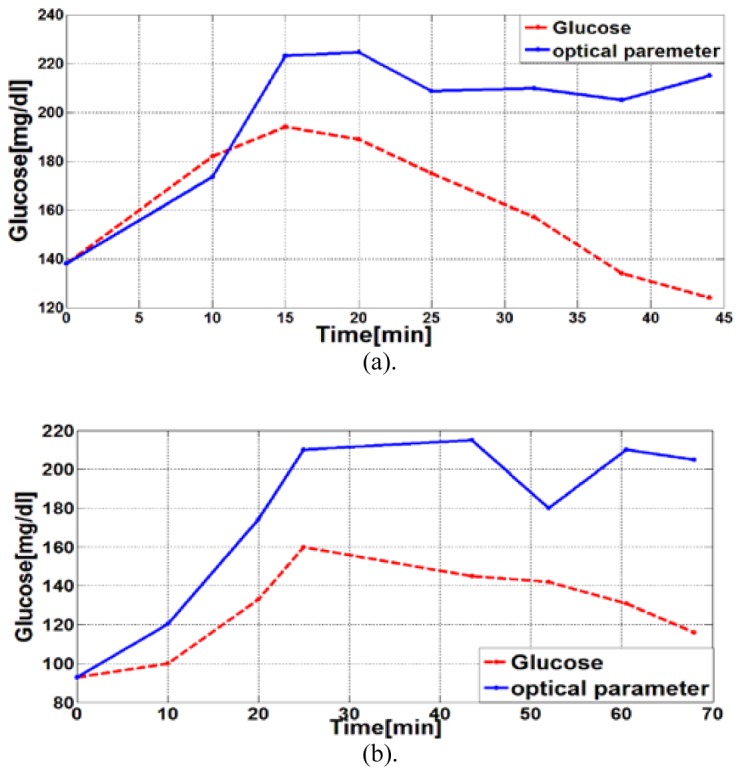
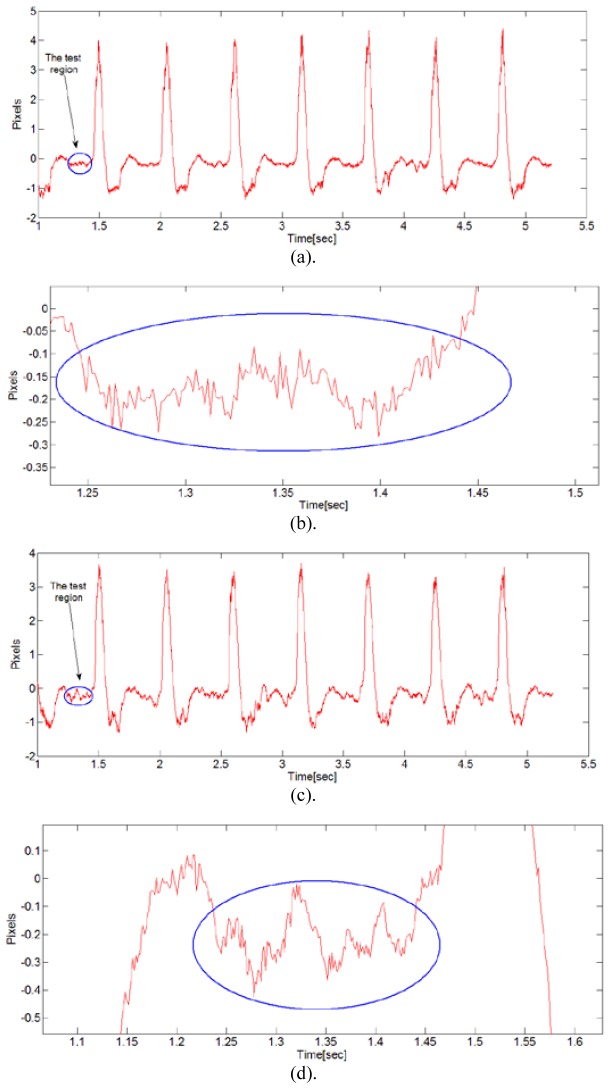
The ability to extract different bio-medical parameters from one single wristwatch device can be very applicable. The wearable device that is presented in this paper is based on two optical approaches. The first is the extraction and separation of remote vibration sources and the second is the rotation of linearly polarized light by certain materials exposed to magnetic fields. The technique is based on tracking of temporal changes of reflected secondary speckles produced in the wrist when being illuminated by a laser beam. Change in skin's temporal vibration profile together with change in the magnetic medium that is generated by time varied glucose concentration caused these temporal changes. In this paper we present experimental tests which are the first step towards an in vivo noncontact device for detection of glucose concentration in blood. The paper also shows very preliminary results for qualitative capability for indication of dehydration.

Keywords: (030.6140) Speckle; (170.0170) Medical optics and biotechnology; (260.2110) Electromagnetic optics; (260.5430) Polarization; (280.0280) Remote sensing and sensors.


Figures

Fig. 1
Fig. 1
Schematic diagram of the system.
Fig. 2
Fig. 2
A flowchart of the glucose concentration effects on the speckle pattern.
Fig. 3
Fig. 3
The optical configuration for remote measuring of glucose levels from the subject’s hand. The subject’s hand is under laser illumination. The magnet is connected to the side of the device.
Fig. 4
Fig. 4
The OCG pulses that were measured by our bracelet setup.
Fig. 5
Fig. 5
Summary of the algorithm.
Fig. 6
Fig. 6
Stability test of the system: The normalized optical parameter during 30 minutes. The difference in values is displayed [in percents].
Fig. 7
Fig. 7
An experiment without the effect of the magnet. Glucose level is denoted with a red line (measured with glucometer device) and the optically measured parameter is denoted with a blue line. (a). First experiment completely without a magnet. (b). Second experiment completely without a magnet.
Fig. 8
Fig. 8
Normalized Glucose level in blood and the normalized peak amplitude of the same subject. Glucose level is denoted with a red line and the optically measured parameter is denoted with a blue line.
Fig. 9
Fig. 9
Normalized Glucose level in blood and the normalized peak amplitude of 4 different subjects. Glucose level is denoted with a red line and the optically measured parameter is denoted with a blue line.
Fig. 10
Fig. 10
(a). The OCG pulses that were measured at the beginning of the experiment in order to calibrate the system. The ellipse marks the region of the fluctuations. (b). Close-up of the fluctuations at the beginning of the experiment (time 0) that corresponds to the ellipse markup in Fig. 6(a). (c). The OCG pulses that were measured at the end of the experiment (after 70 minutes). The ellipse marks the region of the fluctuations. (d). Close-up of the fluctuations at the end of the experiment (after 70 minutes).
Fig. 11
Fig. 11
Weight of tested subjects compared to the maximum amplitude peak measured by the proposed optical device. The weight is denoted by a red line and red axes and the optically measured parameter is denoted by a black line and black axes. (a). First subject. (b). Second subject. (c). Third subject.

References

    1. National Diabetes Information Clearinghouse (NDIC) , http://diabetes.niddk.nih.gov/dm/pubs/statistics/
    1. Danaei G., Finucane M. M., Lu Y., Singh G. M., Cowan M. J., Paciorek C. J., “National, regional, and global trends in fasting plasma glucose and diabetes prevalence since 1980,” Lancet 378, 31–40 (2011). - PubMed
    1. MacKenzie H. A., Ashton H. S., Spiers S., Shen Y., Freeborn S. S., Hannigan J., Lindberg J., Rae P., “Advances in photoacoustic noninvasive glucose testing,” Clin. Chem. 45(9), 1587–1595 (1999). - PubMed
    1. Esenaliev R. O., Larin K. V., Larina I. V., Motamedi M., “Noninvasive monitoring of glucose concentration with optical coherence tomography,” Opt. Lett. 26(13), 992–994 (2001).10.1364/OL.26.000992 - DOI - PubMed
    1. Cameron B. D., Li Y., “Polarization-based diffuse reflectance imaging for noninvasive measurement of glucose,” J. Diabetes Sci. Tech. 1(6), 873–878 (2007).10.1177/193229680700100611 - DOI - PMC - PubMed