. 2014 Jun 18;9(6):e99269.
doi: 10.1371/journal.pone.0099269. eCollection 2014.

Gene expression correlations in human cancer cell lines define molecular interaction networks for epithelial phenotype

Affiliations

Gene expression correlations in human cancer cell lines define molecular interaction networks for epithelial phenotype

Kurt W Kohn et al. PLoS One. .

Abstract

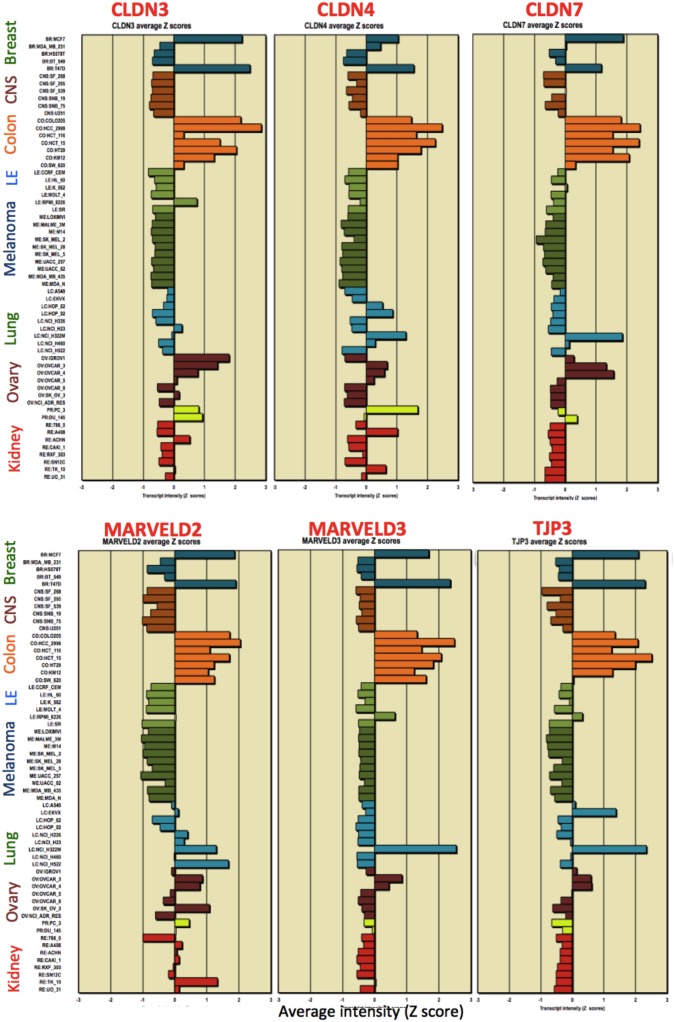
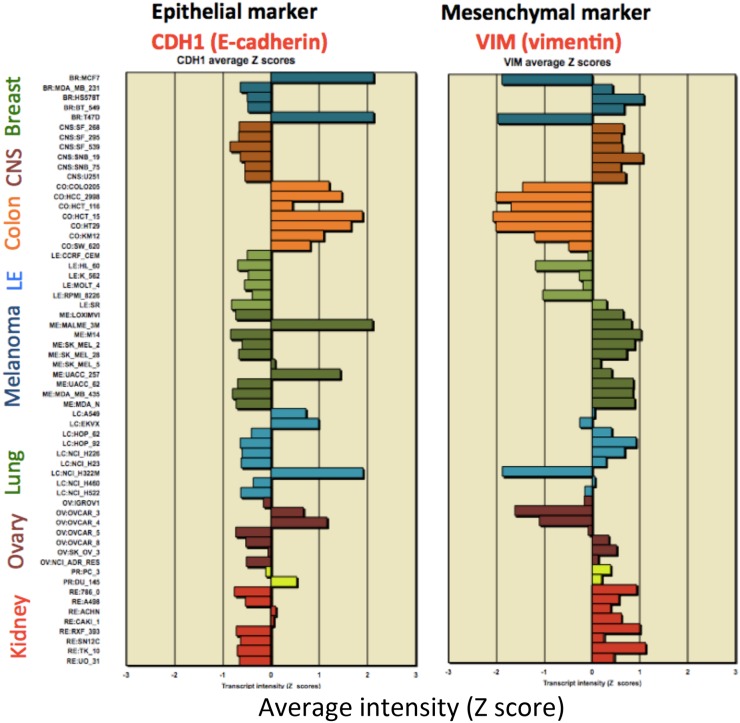
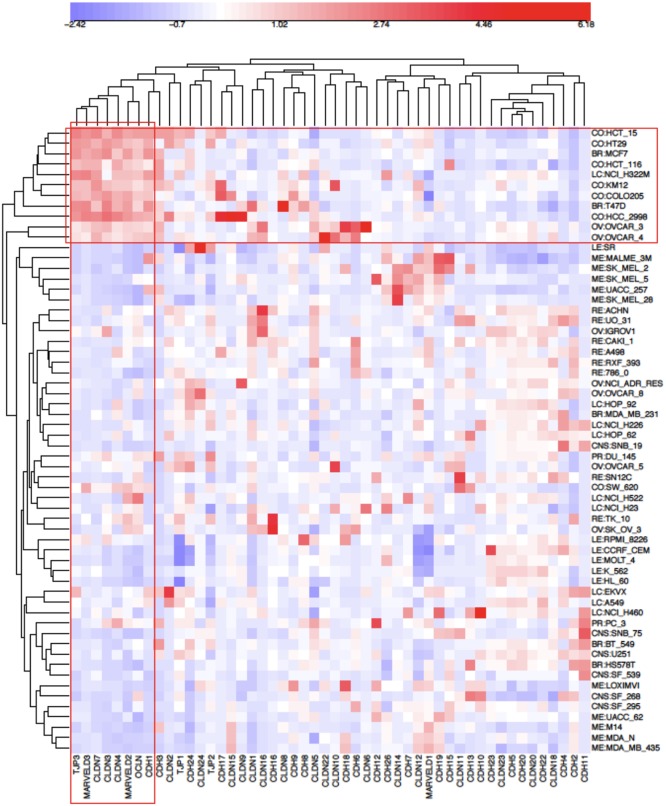
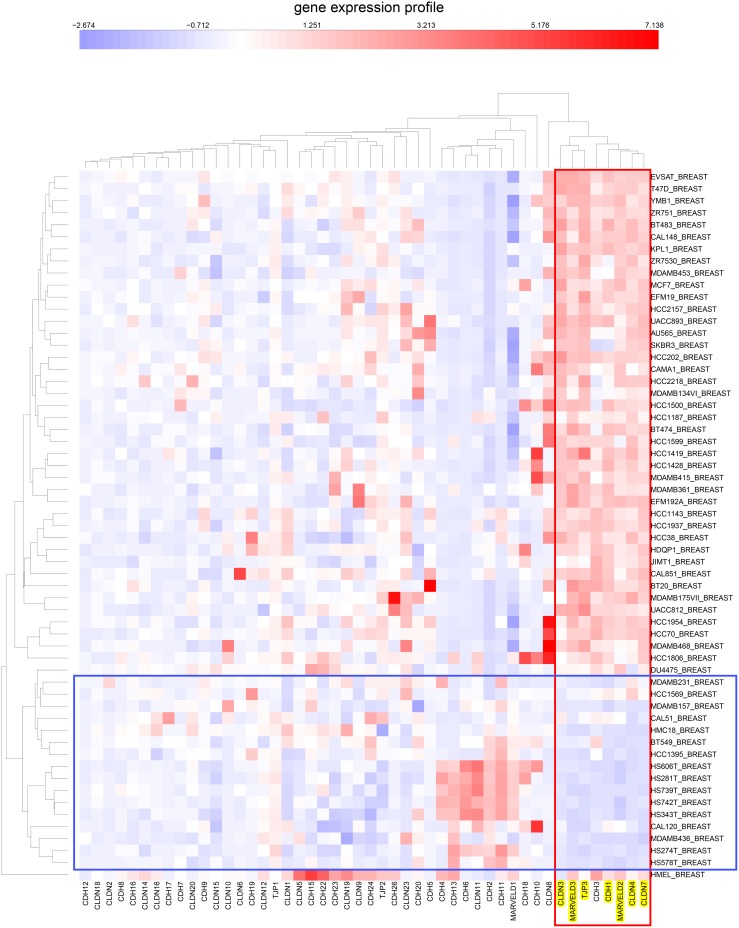
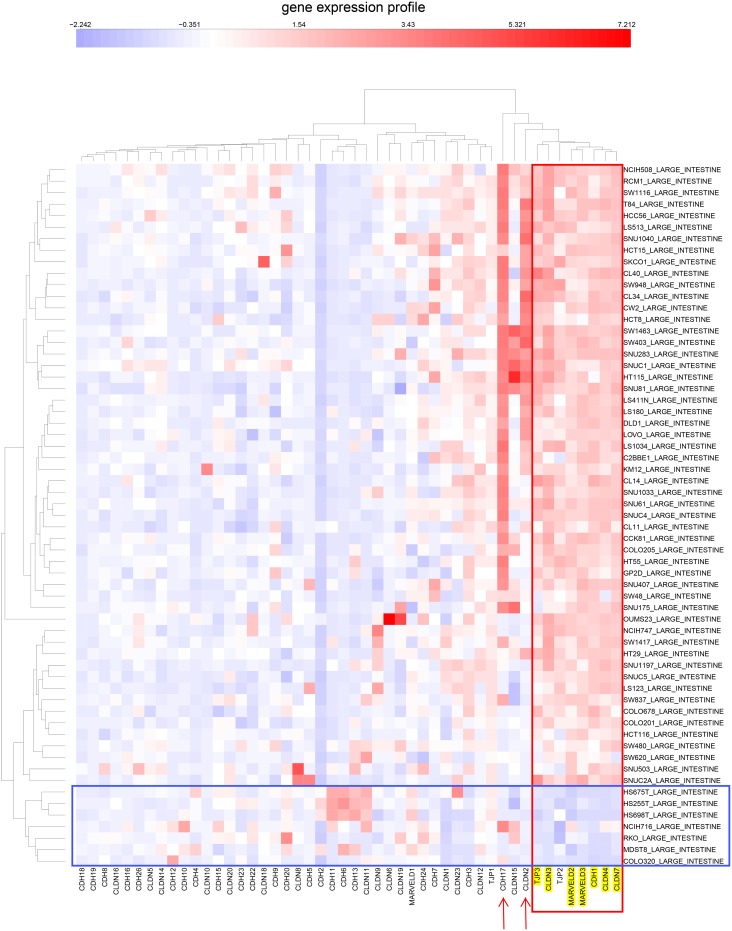
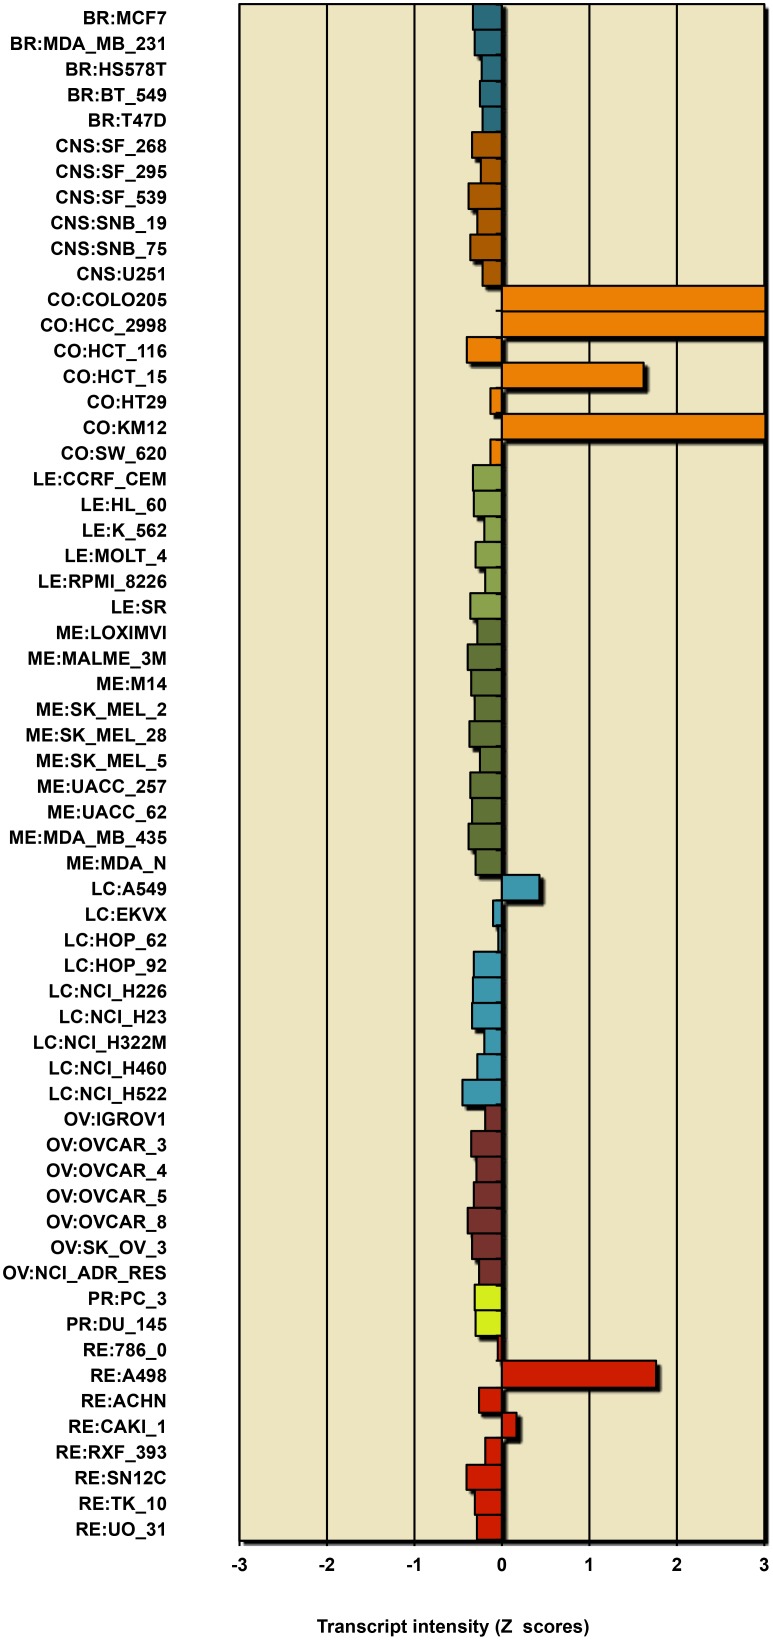
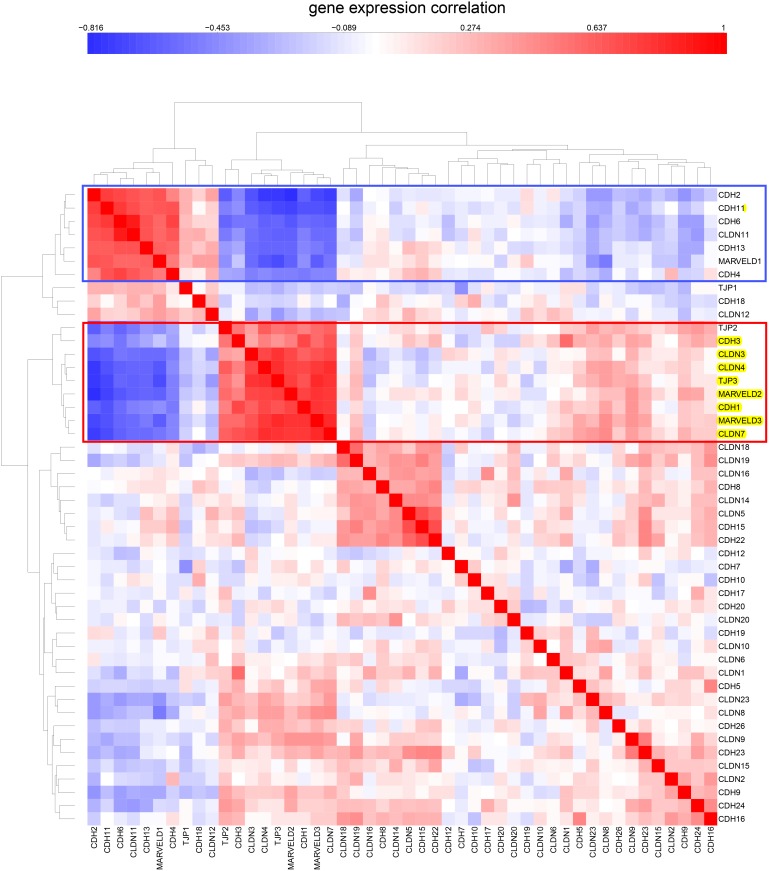
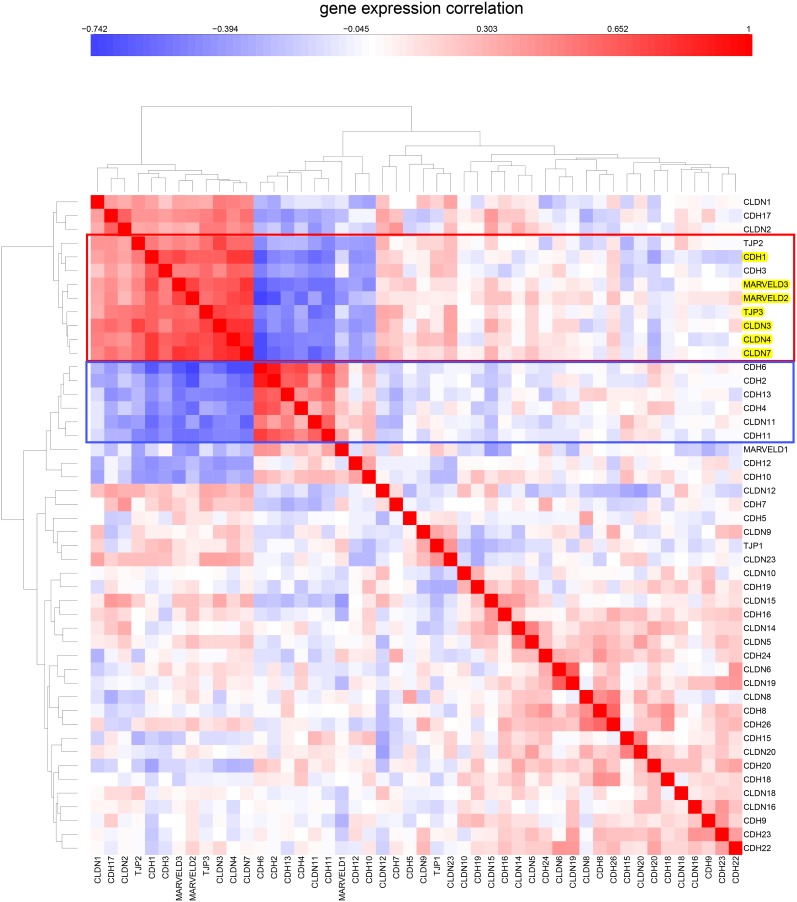
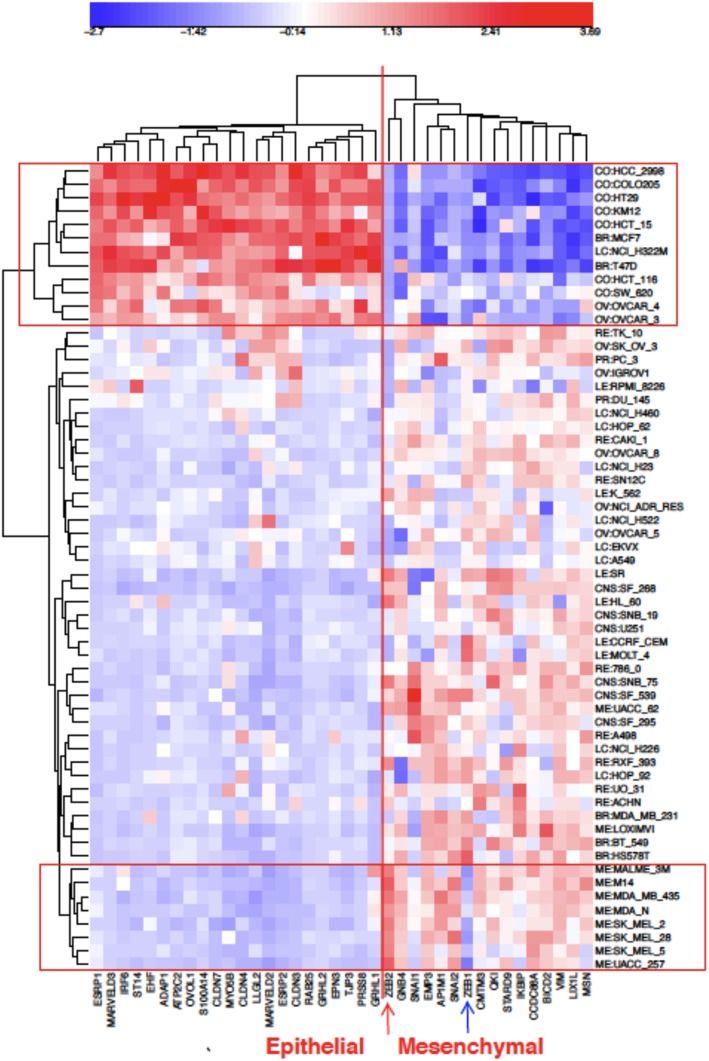
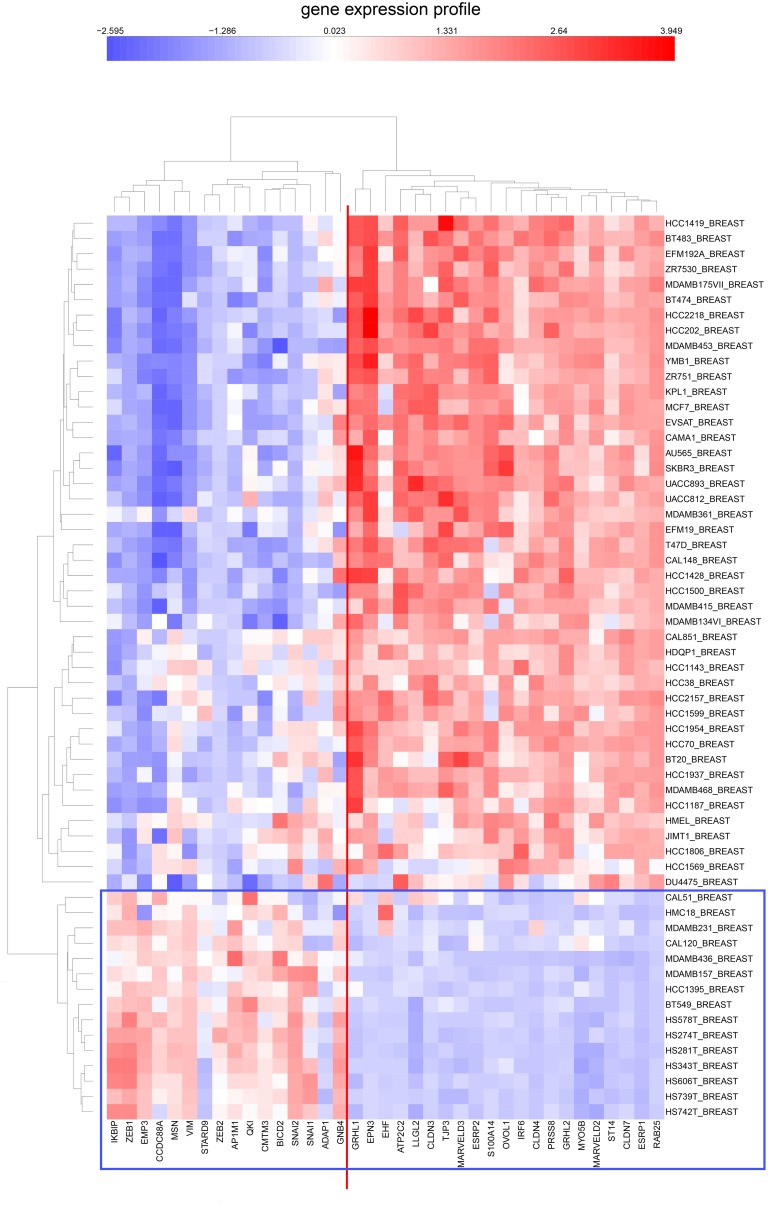
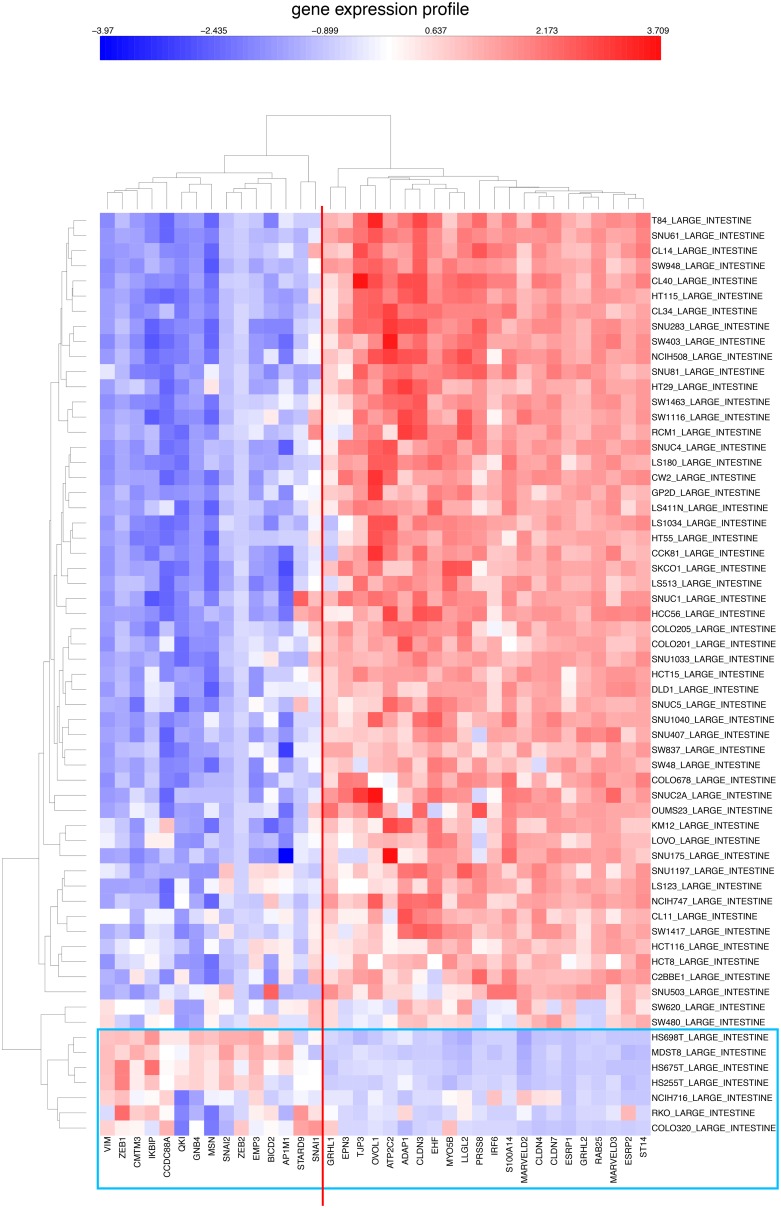
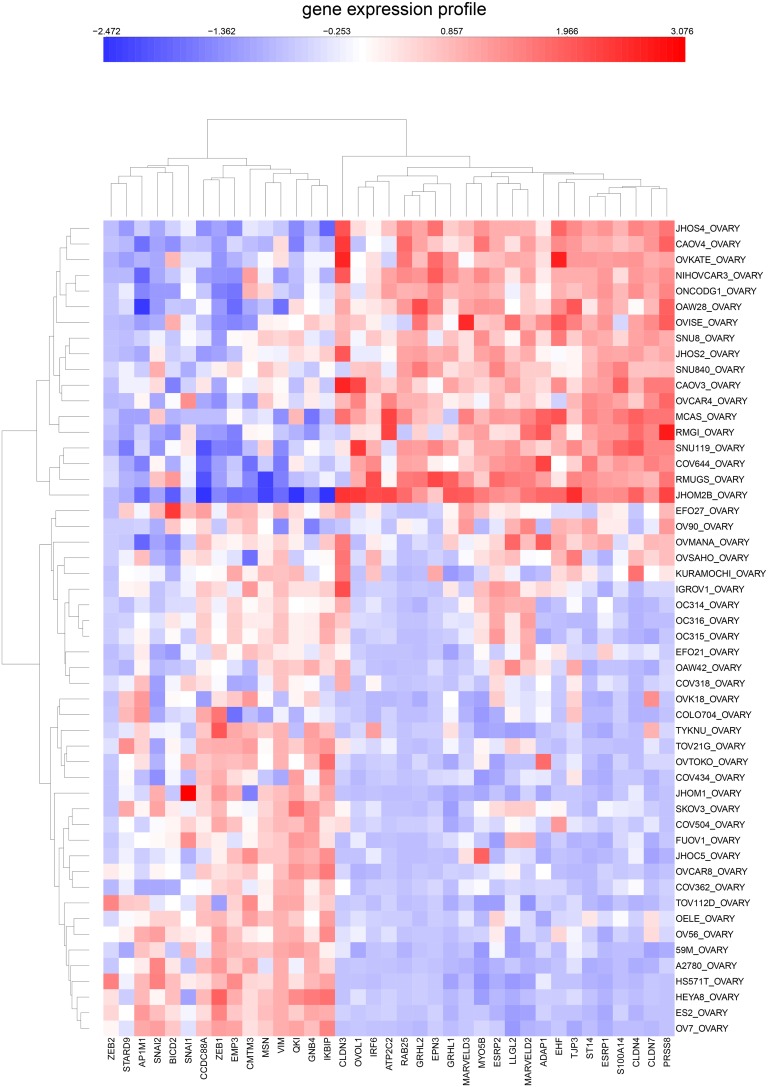
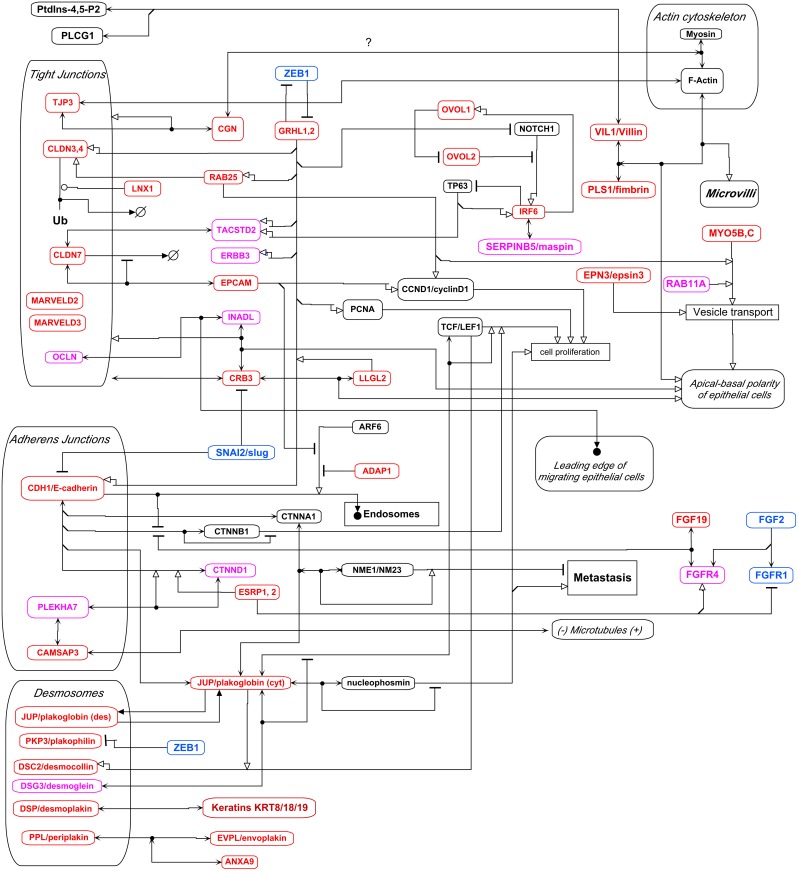
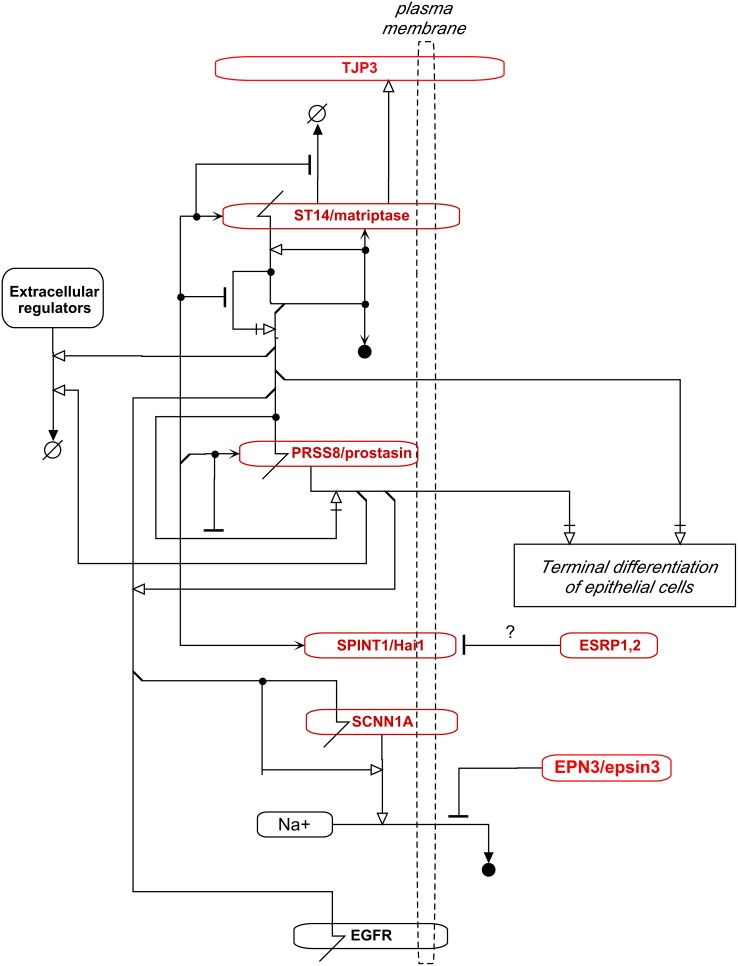
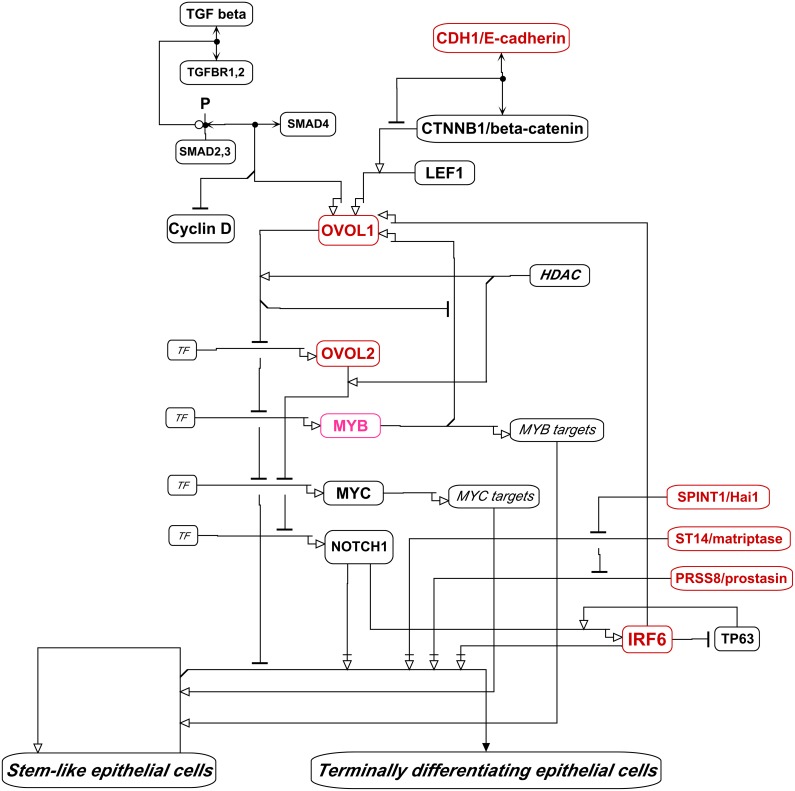
Using gene expression data to enhance our knowledge of control networks relevant to cancer biology and therapy is a challenging but urgent task. Based on the premise that genes that are expressed together in a variety of cell types are likely to functions together, we derived mutually correlated genes that function together in various processes in epithelial-like tumor cells. Expression-correlated genes were derived from data for the NCI-60 human tumor cell lines, as well as data from the Broad Institute's CCLE cell lines. NCI-60 cell lines that selectively expressed a mutually correlated subset of tight junction genes served as a signature for epithelial-like cancer cells. Those signature cell lines served as a seed to derive other correlated genes, many of which had various other epithelial-related functions. Literature survey yielded molecular interaction and function information about those genes, from which molecular interaction maps were assembled. Many of the genes had epithelial functions unrelated to tight junctions, demonstrating that new function categories were elicited. The most highly correlated genes were implicated in the following epithelial functions: interactions at tight junctions (CLDN7, CLDN4, CLDN3, MARVELD3, MARVELD2, TJP3, CGN, CRB3, LLGL2, EPCAM, LNX1); interactions at adherens junctions (CDH1, ADAP1, CAMSAP3); interactions at desmosomes (PPL, PKP3, JUP); transcription regulation of cell-cell junction complexes (GRHL1 and 2); epithelial RNA splicing regulators (ESRP1 and 2); epithelial vesicle traffic (RAB25, EPN3, GRHL2, EHF, ADAP1, MYO5B); epithelial Ca(+2) signaling (ATP2C2, S100A14, BSPRY); terminal differentiation of epithelial cells (OVOL1 and 2, ST14, PRSS8, SPINT1 and 2); maintenance of apico-basal polarity (RAB25, LLGL2, EPN3). The findings provide a foundation for future studies to elucidate the functions of regulatory networks specific to epithelial-like cancer cells and to probe for anti-cancer drug targets.


Conflict of interest statement

Competing Interests: The authors have declared that no competing interests exist.

Figures

Figure 1
Figure 1. Molecular interaction symbols used in the MIM drawing tool .
A small filled circle (“node”) on an interaction line represents the entity or entities that are the consequence of the interaction. For example, a node on a binding interaction line represents the dimer or complex resulting from the binding; a node on a cleavage line represents the product(s) of the cleavage; a node on a modification line, represents the modified entity. For further description of the notation, see and http://discover.nci.nih.gov/mim/mapDesc.html.
Figure 2
Figure 2. NCI-60 gene expression profiles for tight junction genes, showing a pattern of selective expression in 2 breast, 6 colon, 1 lung and 2 ovarian cancer cell lines.
We refer to this subgroup of the NCI-60 cell lines as the “NCI-60 epithelial consensus” (NEC) cell lines. Genes selectively expressed by these cell lines are “NEC genes”.
Figure 3
Figure 3. NCI-60 gene expression profiles for adherens junction gene CDH1/E-cadherin, an epithelial marker, and the mesechymal marker gene, VIM/vimentin.
Nearly all of the cell lines that up-regulate CDH1 down-regulate VIM. Genes that are selectively not expressed by the NEC cell lines often have mesenchymal functions.
Figure 4
Figure 4. Clustered image map of NCI-60 mRNA expression levels for tight junction family and cadherin family genes.
The genes and cell lines of the NCI-60 epithelial consensus (NEC) signature (Table 1) are boxed in red rectangles. The NEC genes are seen to constitute a subset of the tight junction and cadherin family genes.
Figure 5
Figure 5. Clustered image map of the expression of tight-junction family and cadherin family genes (same gene set as in Figure 4) in CCLE breast cancer cell lines.
The cluster containing the NEC genes is marked in a vertical box. The cell lines exhibiting distinctly reduced expression of NEC genes are enclosed in a horizontal box.
Figure 6
Figure 6. Similar to Figure 5, but for CCLE colon cancer cell lines.
Figure 7
Figure 7. Expression of CDH17 mRNA in NCI-60 cell lines, showing selective expression in colon cancer cell lines.
Figure 8
Figure 8. Expression correlations for tight-junction and cadherin family genes in CCLE breast cancer cell lines.
The cluster containing the NEC genes is in a red box. A cluster containing genes whose expressions are inversely correlated relative to the NEC genes are in a blue box.
Figure 9
Figure 9. Similar to Figure 8, but showing CCLE colon cell lines.
Figure 10
Figure 10. Expression of epithelial and mesenchymal genes in the NCI-60 cell lines.
The genes shown were the most up-regulated (“epithelial”) or down-regulated (“mesenchymal”) in the NEC cell lines from Tables 2 and 4, respectively. The NEC cell lines cluster together as expected (top rectangle). Melanoma cell lines formed a separate cluster (bottom rectangle). Note the high expression of ZEB2 and low expression of ZEB1 (red and blue arrows at bottom).
Figure 11
Figure 11. Expression of epithelial and mesenchymal genes in CCLE breast cancer cell lines.
The gene set was the same as in Figure 9, except that there were no data for LIXL1. The clustering of the epithelial and mesenchymal genes was the same in the CCLE breast cancer cell lines as in the NCI-60 cell lines.
Figure 12
Figure 12. Similar to Figure 11, but for CCLE colon cancer cell lines.
Figure 13
Figure 13. Similar to Figure 11, but for CCLE ovarian cancer cell lines.
Figure 14
Figure 14. Molecular interaction map (MIM) of interactions at cell-cell junction complexes.
Genes selectively expressed in the NCI-60 epithelial consensus (NEC) cell lines are shown in red. Symbol definitions are shown in Fig. 1.
Figure 15
Figure 15. Regulation of the balance between proliferative and terminally differentiating epithelial cells, based on descriptions by , –}.
The genes that were expressed selectively in the NEC cell lines are denoted in red. Terminal differentiation of epithelial cells requires IRF6, NOTCH1, ST14/matriptase, and PRSS8/prostasin. The actions of the latter two are inhibited by SPINT1/hai1. The continued proliferation or cell division on the path to terminal differentiation requires MYC and MYB. IRF6 and MYB transcriptionally activate OVOL1, which down-regulates the transcription of OVOL2, MYB, and MYC, and tends to inhibit terminal differentiation. OVOL2 inhibits the transcription of MYC and NOTCH1. TP63 enhances the transcription of IRF6, but is down-regulated by IRF6. (See text for further description of the model).
Figure 16
Figure 16. Regulation of the balance between proliferative and terminally differentiating epithelial cells, based on descriptions by , –}.
The interaction system involving ST14/matriptase, PRSS8/prostasin, and SPINT1/Hai1 (detailed in Figure 15) is shown here in abbreviated form. The genes that were expressed selectively in the NEC cell lines are denoted in red. The diagram shows terminal differentiation of epithelial cells requiring IRF6, NOTCH1, ST14/matriptase, and PRSS8/prostasin. The actions of the latter two are inhibited by SPINT1/hai1. The continued proliferation or cell division on the path to terminal differentiation requires MYC and MYB. IRF6 and MYB transcriptionally activate OVOL1, which down-regulates the transcription of OVOL2, MYB, and MYC, and tends to inhibit terminal differentiation. OVOL2 inhibits the transcription of MYC and NOTCH1. TP63 enhances the transcription of IRF6, but is down-regulated by IRF6. Also shown is the regulation of OVOL1 by the TGF beta and beta-catenin pathways.

References

    1. Wang Q, Margolis B (2007) Apical junctional complexes and cell polarity. Kidney Int 72: 1448–1458. - PubMed
    1. Reinhold WC, Sunshine M, Liu H, Varma S, Kohn KW, et al. (2012) CellMiner: A Web-Based Suite of Genomic and Pharmacologic Tools to Explore Transcript and Drug Patterns in the NCI-60 Cell Line Set. Cancer Res 72: 3499–3511. - PMC - PubMed
    1. Kohn KW, Zeeberg BR, Reinhold WC, Sunshine M, Luna A, et al. (2012) Gene expression profiles of the NCI-60 human tumor cell lines define molecular interaction networks governing cell migration processes. PLoS One 7: e35716. - PMC - PubMed
    1. Kohn KW, Aladjem MI, Weinstein JN, Pommier Y (2006) Molecular interaction maps of bioregulatory networks: a general rubric for systems biology. Mol Biol Cell 17: 1–13. - PMC - PubMed
    1. Luna A, Sunshine ML, van Iersel MP, Aladjem MI, Kohn KW (2011) PathVisio-MIM: PathVisio plugin for creating and editing Molecular Interaction Maps (MIMs). Bioinformatics 27: 2165–2166. - PMC - PubMed

Publication types

Substances

Associated data