. 2014 Jun 17;106(12):2585-94.
doi: 10.1016/j.bpj.2014.05.001.

Amyloids of alpha-synuclein affect the structure and dynamics of supported lipid bilayers

Affiliations

Amyloids of alpha-synuclein affect the structure and dynamics of supported lipid bilayers

Aditya Iyer et al. Biophys J. .

Abstract

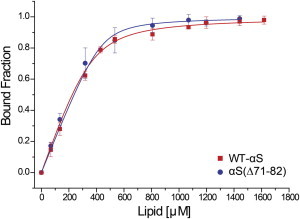
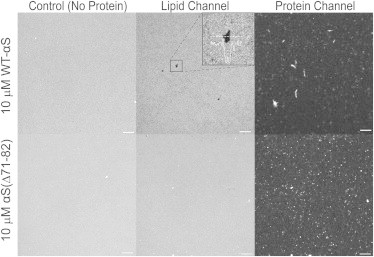
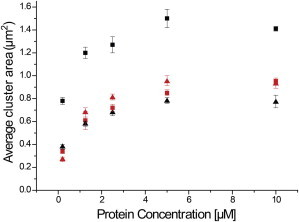
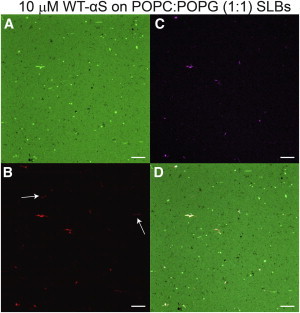
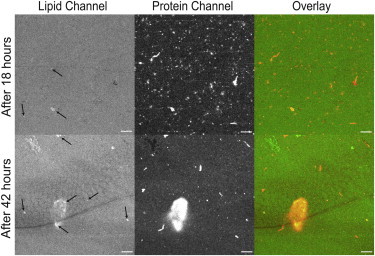
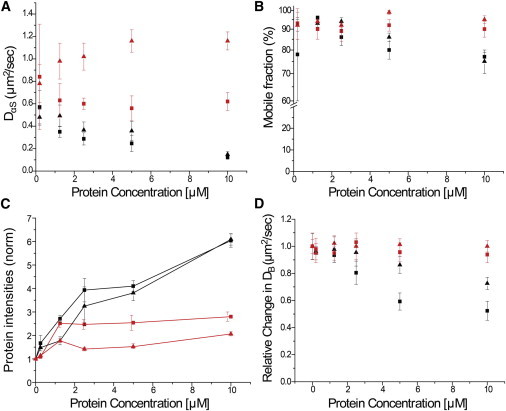
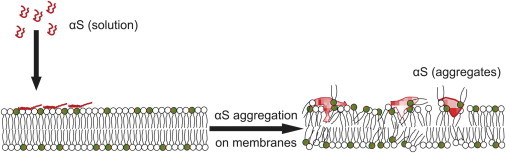
Interactions of monomeric alpha-synuclein (αS) with lipid membranes have been suggested to play an important role in initiating aggregation of αS. We have systematically analyzed the distribution and self-assembly of monomeric αS on supported lipid bilayers. We observe that at protein/lipid ratios higher than 1:10, αS forms micrometer-sized clusters, leading to observable membrane defects and decrease in lateral diffusion of both lipids and proteins. An αS deletion mutant lacking amino-acid residues 71-82 binds to membranes, but does not observably affect membrane integrity. Although this deletion mutant cannot form amyloid, significant amyloid formation is observed in the wild-type αS clusters. These results suggest that the process of amyloid formation, rather than binding of αS on membranes, is crucial in compromising membrane integrity.


Figures

Figure 1
Figure 1
Binding of WT-αS and αS(Δ71–82)with POPC/POPG liposomes. Titration of WT-αS (red squares) and αS(Δ71–82) (blue circles) by POPC/POPG (50:50) SUVs. The bound fractions were obtained by measuring mean residual ellipticities at 222 nm by CD spectroscopy (Materials and Methods). The binding curve was generated by fitting normalized ellipticity values to Eq. 2 (solid lines), assuming equivalent binding sites. The error bars indicate standard deviations from three independent measurements. To see this figure in color, go online.
Figure 2
Figure 2
Clustering of WT-αS and αS(Δ71–82) on POPC/POPG supported lipid bilayers. Representative images of SLBs after adsorption of 10 μM αS for 18 h. The protein images show bigger and more heterogeneous WT-αS protein aggregates on 50% POPG-containing bilayers as compared to those of αS(Δ71–82) mutant. There appears to be little correlation between the defects on the SLBs and the bigger aggregates. The lipid images show the appearance of cracks and defects in the top panels (WT-αS). (Inset) Enhanced magnification. The sparse lipid clustering (seen as bright spots) was also seen in the controls and αS(Δ71–82) aggregates do not seem to have a preference for these regions. Fewer and smaller defects appear in the presence of αS(Δ71–82) and the average intensity remains the same. Images are contrasted to the same extent to facilitate comparison. All experiments were performed at room temperature in 50 mM HEPES, pH 7.4, 0.1 mM EDTA buffer. The scale bar is 10 μm.
Figure 3
Figure 3
Average cluster areas of αS on SLBs with changing protein concentration and lipid composition. Average cluster areas obtained by fitting the area distributions obtained from αS aggregates on POPC/POPG SLBs. Upon increasing protein concentration, there is a twofold increase in the average cluster areas irrespective of the lipid composition for both WT-αS and αS(Δ71–82). However, for a given protein concentration, αS(Δ71–82) clusters (red symbols) show little dependence on lipid composition contrary to that observed for the WT-αS clusters (black symbols). Cluster areas for WT-αS and αS(Δ71–82) on 50% POPG SLBs (squares) and 25% POPG SLBs (triangles). The error bars indicate standard errors in each case. The statistics underlying the values presented here are shown in Table S1 in the Supporting Material. To see this figure in color, go online.
Figure 4
Figure 4
ThioflavinT (ThT) staining of WT-αS aggregates. Representative fluorescence images depicting the lipid channel (A) and protein channel (B) after 18 h incubation of 10 μM labeled WT-αS on POPC/POPG SLB. (White arrows) Aggregates of WT-αS which are not positive for ThT. (C) Fluorescence images taken after ThT staining. (D) Overlay of all channels. Lipid composition of the bilayer was POPC/POPG/BODIPY-PC, 50:49.75:0.25 (mol/mol). All images were taken at room temperature in 50 mM HEPES, 0.1 mM EDTA, pH 7.4 buffer. The scale bar is 10 μm. To see this figure in color, go online.
Figure 5
Figure 5
Time-dependent growth of WT-αS aggregates on POPC/POPG (50:50) SLBs. The images shown are representative endpoint images obtained after incubation of 10 μM WT-αS on POPC/POPG (50:50) after 18 h (top panel) and the same bilayer incubated for another 24 h (bottom panel). Upon incubation for 18 h, large aggregates are seen on the bilayer surface but these aggregates do not coincide with regions of high membrane damage. After 42 h, very large aggregates appear that in some regions appear to incorporate lipids. (Solid arrows) Lipids lining along the shape of the aggregate suggesting incorporation. Images are contrasted to the same extent to facilitate proper comparison. All experiments were performed at room temperature in 50 mM HEPES, pH 7.4, 0.1 mM EDTA buffer. The scale bar is 10 μm. To see this figure in color, go online.
Figure 6
Figure 6
Effects of adsorption of αS on lipid and protein dynamics of the SLBs. In all the figures, measurements with WT-αS are shown (black symbols), and those with αS(Δ71–82) (red symbols); measurements on 50% POPG-containing membranes (square symbols) and those on 25% POPG-containing membranes (triangular symbols). (A) Apparent protein diffusion coefficients (DαS). (B) Mobile fractions in protein channel obtained from FRAP upon incubation of αS WT-αS and αS(Δ71–82) on POPC/POPG SLBs in increasing concentrations. (C) Average intensities (normalized to background of red channel) obtained from protein channels after 18 h incubation and removal of unbound protein. The WT-αS clearly shows a concentration-dependent rise in adsorbed protein irrespective of % of negative charge on SLBs, whereas αS(Δ71–82) intensities do not change with concentration. (D) Protein concentration-dependent changes in lateral diffusion coefficients of BODIPY-PC (DB) relative to that in the absence of protein. The error bars indicate standard deviation obtained from five independent measurements in panels AC and from 10 independent measurements in panel D. All experiments were performed at room temperature in 50 mM HEPES, pH 7.4, 0.1 mM EDTA buffer. Note: the protein diffusion measurements (B and C) at 200 nM had poor signal/background and therefore much poorer fits to the recovery curves and greater variability in both diffusion coefficient and mobile fractions estimates. To see this figure in color, go online.
Figure 7
Figure 7
Model for lipid membrane disruption by α-synuclein. To see this figure in color, go online.

References

    1. Spillantini M.G., Schmidt M.L., Goedert M. Alpha-synuclein in Lewy bodies. Nature. 1997;388:839–840. - PubMed
    1. Fiskum G., Starkov A., Chinopoulos C. Mitochondrial mechanisms of neural cell death and neuroprotective interventions in Parkinson’s disease. Ann. N. Y. Acad. Sci. 2003;991:111–119. - PubMed
    1. Polymeropoulos M.H., Lavedan C., Nussbaum R.L. Mutation in the α-synuclein gene identified in families with Parkinson’s disease. Science. 1997;276:2045–2047. - PubMed
    1. Nemani V.M., Lu W., Edwards R.H. Increased expression of α-synuclein reduces neurotransmitter release by inhibiting synaptic vesicle reclustering after endocytosis. Neuron. 2010;65:66–79. - PMC - PubMed
    1. Farrer M.J. Genetics of Parkinson disease: paradigm shifts and future prospects. Nat. Rev. Genet. 2006;7:306–318. - PubMed

LinkOut - more resources