Comparative Study
. 2014 Jun 18;9(6):e99928.
doi: 10.1371/journal.pone.0099928. eCollection 2014.

Comparative analysis of the base compositions of the pre-mRNA 3' cleaved-off region and the mRNA 3' untranslated region relative to the genomic base composition in animals and plants

Affiliations
Comparative Study

Comparative analysis of the base compositions of the pre-mRNA 3' cleaved-off region and the mRNA 3' untranslated region relative to the genomic base composition in animals and plants

Xiu-Qing Li. PLoS One. .

Abstract

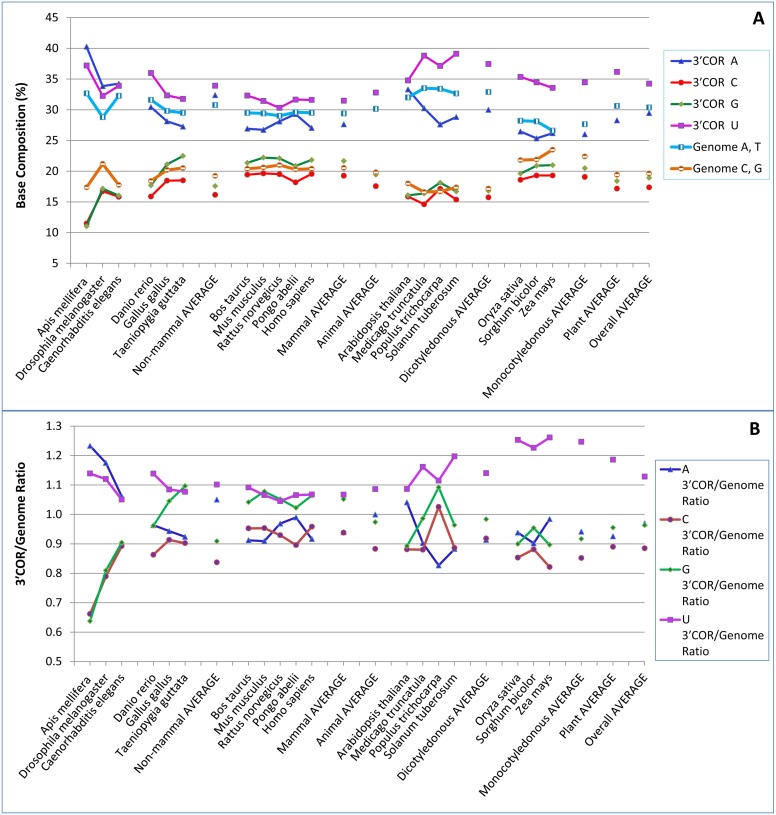
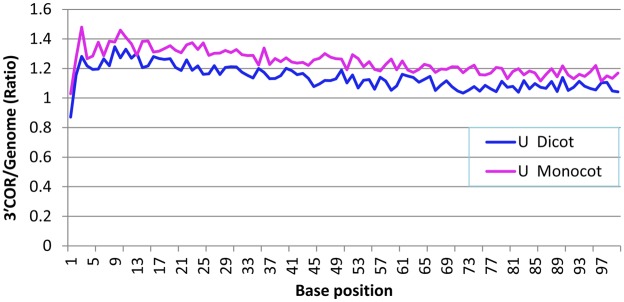
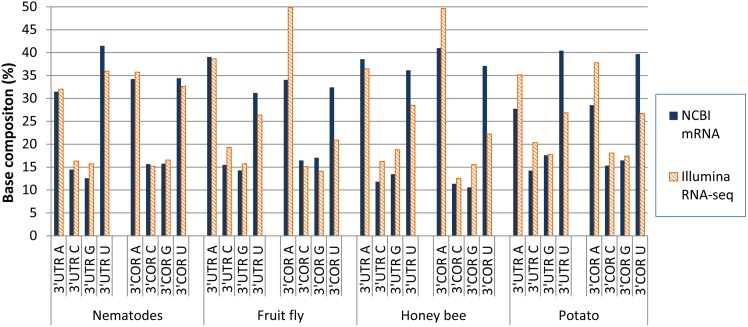
The precursor messenger RNA (pre-mRNA) three-prime cleaved-off region (3'COR) and the mRNA three-prime untranslated region (3'UTR) play critical roles in regulating gene expression. The differences in base composition between these regions and the corresponding genomes are still largely uncharacterized in animals and plants. In this study, the base compositions of non-redundant 3'CORs and 3'UTRs were compared with the corresponding whole genomes of eleven animals, four dicotyledonous plants, and three monocotyledonous (cereal) plants. Among the four bases (A, C, G, and U for adenine, cytosine, guanine, and uracil, respectively), U (which corresponds to T, for thymine, in DNA) was the most frequent, A the second most frequent, G the third most frequent, and C the least frequent in most of the species in both the 3'COR and 3'UTR regions. In comparison with the whole genomes, in both regions the U content was usually the most overrepresented (particularly in the monocotyledonous plants), and the C content was the most underrepresented. The order obtained for the species groups, when ranked from high to low according to the U contents in the 3'COR and 3'UTR was as follows: dicotyledonous plants, monocotyledonous plants, non-mammal animals, and mammals. In contrast, the genomic T content was highest in dicotyledonous plants, lowest in monocotyledonous plants, and intermediate in animals. These results suggest the following: 1) there is a mechanism operating in both animals and plants which is biased toward U and against C in the 3'COR and 3'UTR; 2) the 3'UTR and 3'COR, as functional units, minimized the difference between dicotyledonous and monocotyledonous plants, while the dicotyledonous and monocotyledonous genomes evolved into two extreme groups in terms of base composition.


Conflict of interest statement

Competing Interests: The author has declared that no competing interests exist.

Figures

Figure 1
Figure 1. RNA base compositions of the three-prime cleaved-off region (3′COR), represented by the 100 bases downstream of the polyadenylation [poly(A)] site.
(A) Base compositions of the 3′COR and the whole genome of each species. (B) 3′COR/genome ratios for base composition. The mapping used NCBI mRNA sequences. The mapped extra copies were eliminated if the sequences in the 100-base three-prime untranslated region were identical. Note that for the 3′COR, U was richest in all species except Apis mellifera and Drosophila melanogaster, two insect invertebrates, in which A was richest. In Caenorhabditis elegans (a nematode), the A, C, G and U contents in the 3′COR are 34.3%, 15.8%, 16.0%, and 33.9%, respectively. Monocotyledonous plants had lower U contents but higher 3′COR/genome ratios in the 3′COR than did dicotyledonous plants.
Figure 2
Figure 2. RNA base composition of each position in the 100-nucleotide region of the three-prime cleaved-off region (3′COR) downstream of the polyadenylation [poly(A)] site.
The mapping used NCBI mRNA sequences. Note that both dicotyledonous and monocotyledonous plants had similar variation tendencies, particularly for the first few bases. In comparison with dicotyledonous plants, however, monocotyledonous plants always had a greater 3′COR/genome ratio for U frequency at each position among all the mapped unique poly(A) sites.
Figure 3
Figure 3. RNA base compositions of the three-prime untranslated region (3′UTR), represented by the 100 bases upstream of the polyadenylation [poly(A)] site.
(A) Base compositions of the 3′UTR and the whole genome of each species. (B) 3′UTR/genome ratios of base composition. The mapping used NCBI mRNA sequences. The mapped extra copies were eliminated if the sequences in the 100-base 3′UTR were identical. Note that for the 3′UTR, compared with other nucleotides, U was the richest in all species except Apis mellifera and Drosophila melanogaster, two insect invertebrates, in which A was the richest (Figure 3A). Monocotyledonous plants had lower U contents but higher 3′UTR/genome ratios in the 3′UTR than did dicotyledonous plants. The U content in the 3′UTR was significantly different between dicotyledonous plants and monocotyledonous plants and between non-mammal animals and mammals according to one-way ANOVA and Duncan’s multiple range test at the P<0.05 level (Table 2). The C content in the 3′UTR was significantly different between non-mammal animals (15.82%) and mammals (18.73%) and between dicotyledonous plants (14.53%) and monocotyledonous plants (17.47%) according to the same tests.
Figure 4
Figure 4. Base composition around poly(A) sites in comparison between NCBI mRNA-based mapping and Illumina HiSeq reads-based mapping.
Nematode: Caenorhabditis elegans. Fruit fly: Drosophila melanogaster. Honey bee: Apis mellifera. Potato: Solanum tuberosum (Group Phureja, diploid).
Figure 5
Figure 5. Adenosine content (i.e., A content) for the first six bases of 3′COR.
This 6 bases include the poly(A) site and the 5 immediately downstream bases. The A content represents the average percentage of A in the 6-base region of all mapped poly(A) sites. The RNA-Seq reads were from TruSeq using Illumina HiSeq 2000 or 2500. Information about the Sequence Read Achives (SRA) transcriptomic files can be found in Table 5. NCBI mRNA and RNA-Seq reads were significantly different in this 6-base region according the Excel “ChiTest” in each of these four species (P<0.0001). Note that this six-base region showed higher adenosine content in mapping with RNA-Seq reads than mapping with NCBI mRNA.

Similar articles

Cited by

References

    1. Chambers A, Old R (1988) RNA 3′ cleavage and polyadenylation in oocytes and unfertilized eggs of Xenopus laevis . Dev Biol 125: 237–245. - PubMed
    1. Yamanaka S, Yamashita A, Harigaya Y, Iwata R, Yamamoto M (2010) Importance of polyadenylation in the selective elimination of meiotic mRNAs in growing S. pombe cells. EMBO J 29: 2173–2181. - PMC - PubMed
    1. Birse CE, Minvielle-Sebastia L, Lee BA, Keller W, Proudfoot NJ (1998) Coupling termination of transcription to messenger RNA maturation in yeast. Science 280: 298–301. - PubMed
    1. Juge F, Zaessinger S, Temme C, Wahle E, Simonelig M (2002) Control of poly(A) polymerase level is essential to cytoplasmic polyadenylation and early development in Drosophila . EMBO J 21: 6603–6613. - PMC - PubMed
    1. Schisa JA, Strickland S (1998) Cytoplasmic polyadenylation of Toll mRNA is required for dorsal-ventral patterning in Drosophila embryogenesis. Development 125: 2995–3003. - PubMed

Publication types