. 2014 Jun 18;9(6):e100204.
doi: 10.1371/journal.pone.0100204. eCollection 2014.

Whole brain expression of bipolar disorder associated genes: structural and genetic analyses

Affiliations

Whole brain expression of bipolar disorder associated genes: structural and genetic analyses

Michael J McCarthy et al. PLoS One. .

Abstract

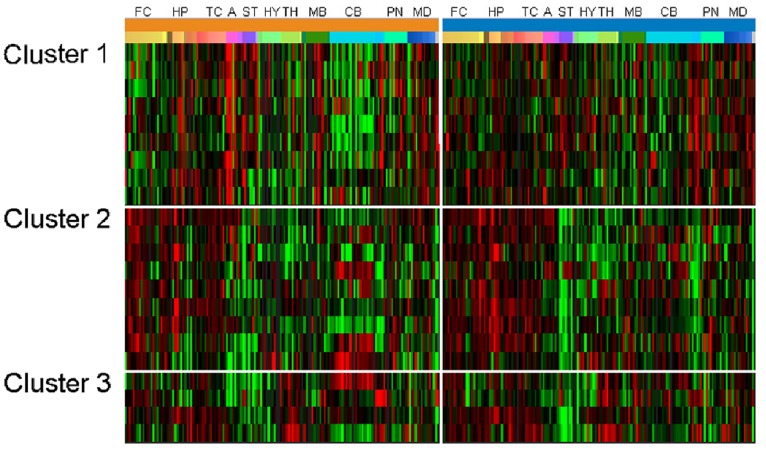
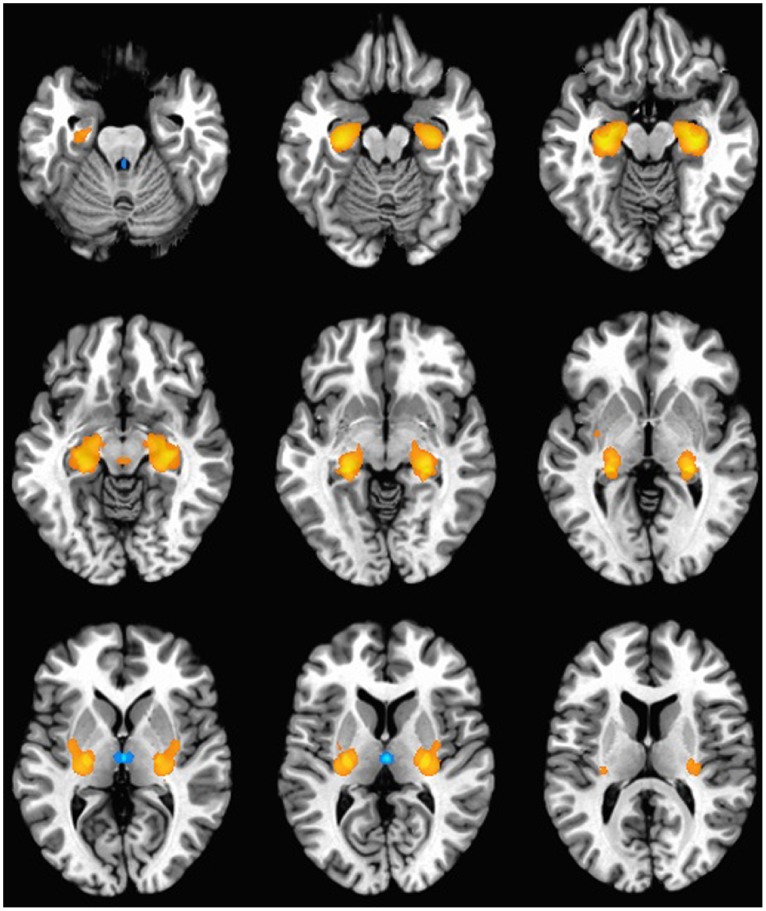
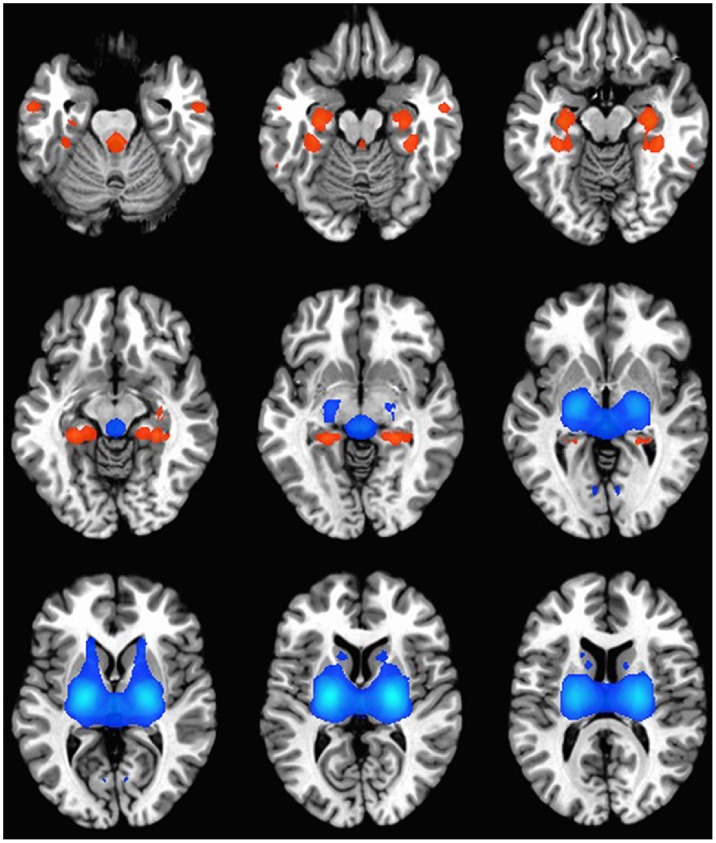
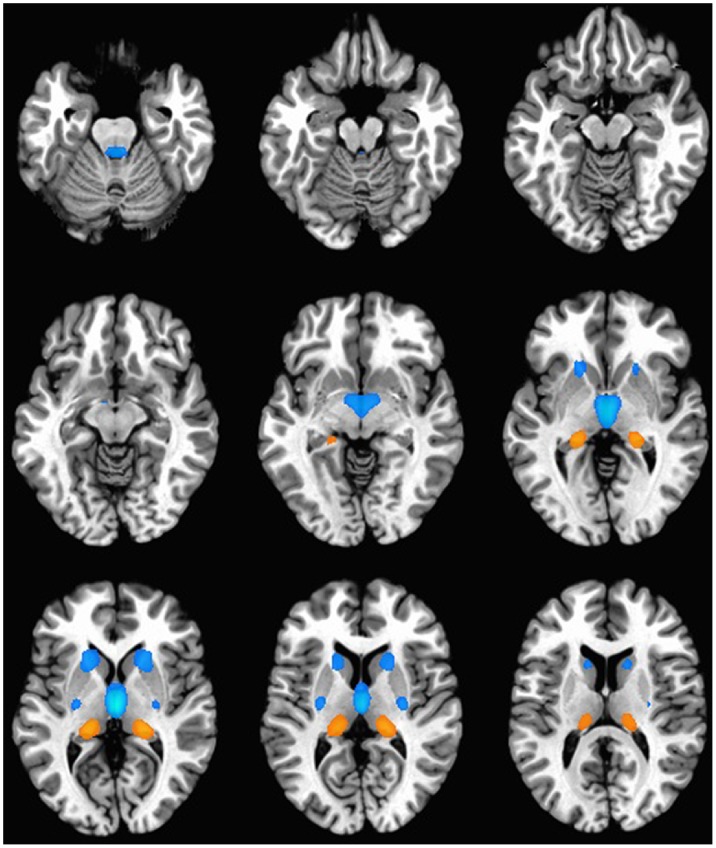
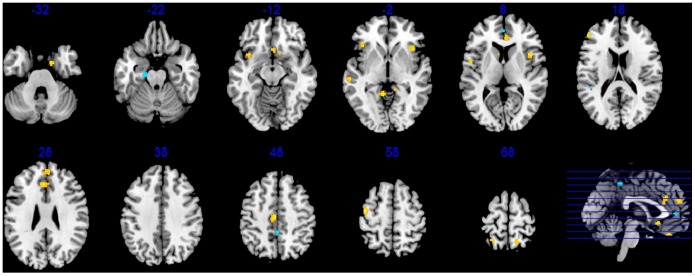
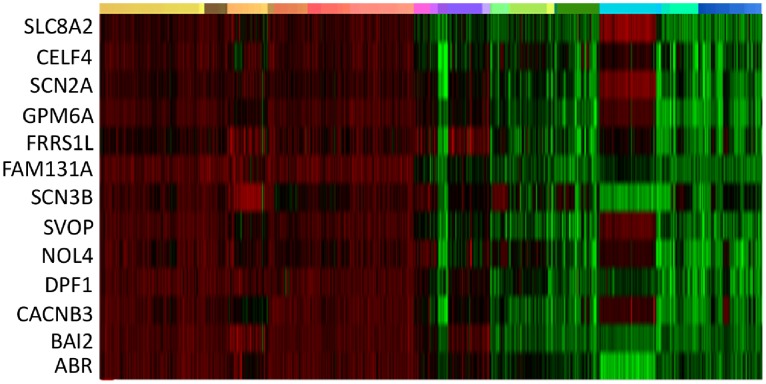
Studies of bipolar disorder (BD) suggest a genetic basis of the illness that alters brain function and morphology. In recent years, a number of genetic variants associated with BD have been identified. However, little is known about the associated genes, or brain circuits that rely upon their function. Using an anatomically comprehensive survey of the human transcriptome (The Allen Brain Atlas), we mapped the expression of 58 genes with suspected involvement in BD based upon their relationship to SNPs identified in genome wide association studies (GWAS). We then conducted a meta-analysis of structural MRI studies to identify brain regions that are abnormal in BD. Of 58 BD associated genes, 22 had anatomically distinct expression patterns that could be categorized into one of three clusters (C1-C3). Brain regions with the highest and lowest expression of these genes did not overlap strongly with anatomical sites identified as abnormal by structural MRI except in the parahippocampal gyrus, the inferior/superior temporal gyrus and the cerebellar vermis, regions where overlap was significant. Using the 22 genes in C1-C3 as reference points, additional genes with correlated expression patterns were identified and organized into sets based on similarity. Further analysis revealed that five of these gene sets were significantly associated with BD, suggesting that anatomical expression profile is correlated with genetic susceptibility to BD, particularly for genes in C2. Our data suggest that expression profiles of BD-associated genes do not explain the majority of structural abnormalities observed in BD, but may be useful in identifying new candidate genes. Our results highlight the complex neuroanatomical basis of BD, and reinforce illness models that emphasize impaired brain connectivity.


Conflict of interest statement

Competing Interests: The authors have declared that no competing interests exist.

Figures

Figure 1
Figure 1. Whole brain expression patterns of BD-associated genes.
Expression of 22 BD-associated genes is organized by cluster for each of two brains (indicated by the thick orange and blue line). Each row represents a single gene, and each column represents one of ∼900 brain regions. Brain regions are organized anatomically, by broadly defined regions where FC: frontal cortex, HP: hippocampus, TC: temporal cortex, A: amygdala ST: striatum, HY: hypothalamus, TH: thalamus, MB: midbrain, CB: cerebellum, PN: pontine nuclei, MD: medulla.
Figure 2
Figure 2. Cluster 1 gene expression pattern.
An idealized human brain shown in horizontal cross section indicates the anatomical regions enriched (orange and red) and depleted (blue) in gene expression associated with C1. For improved visualization, gene expression in corresponding regions of the right and left hemispheres has been consolidated and shown in mirror image bilaterally. C1 is defined by high expression in the parahippocampal gyrus, hippocampus and posterior thalamus.
Figure 3
Figure 3. Cluster 2 gene expression pattern.
An idealized human brain shown in horizontal cross section indicates the anatomical regions enriched (orange and red) and depleted (blue) in gene expression associated with C2. For improved visualization, gene expression in corresponding regions of the right and left hemispheres has been consolidated and shown in mirror image bilaterally. C2 is defined by high expression in portions of the hippocampus, temporal cortex, and midbrain, and very low expression in the striatum, and posterior thalamus.
Figure 4
Figure 4. Cluster 3 gene expression pattern.
An idealized human brain shown in horizontal cross section indicates the anatomical regions enriched (orange and red) and depleted (blue) in gene expression associated with C3. For improved visualization, gene expression in corresponding regions of the right and left hemispheres has been consolidated and shown in mirror image bilaterally. C3 is defined by high expression in the posterior thalamus and very low expression in the striatum (caudate and putamen).
Figure 5
Figure 5. Brain regions identified by volumetric meta analysis.
An idealized human brain shown in horizontal cross section indicates the anatomical regions that are on average, larger in volume in controls compared to BD (yellow) or smaller in controls compared to BD (blue).
Figure 6
Figure 6. Gene expression pattern of CACNB3 is correlated with BD risk associated genes identified by set analysis.
Genes that are expressed in anatomical patterns similar to BD-associated genes are more likely to contain risk-associated SNPs in set based genetic analyses. The C2 gene, CACNB3 is shown as an example, in which twelve additional genes with expression patterns highly correlated with CACNB3 are shown. The same genes are in close proximity to, or contain SNPs that contributed signal to the set-based association with BD, even though they were not previously identified as having strong associations in GWAS. Brain regions are organized anatomically, FC: frontal cortex, IN: insula, CN: cingulate, HP: hippocampus, L: lingual gyrus, TC: temporal cortex, A: amygdale, ST: striatum, HY: hypothalamus, TH: thalamus, MB: midbrain, CB: cerebellum, PN: pontine nuclei, MD: medulla.

References

    1. McGuffin P, Rijsdijk F, Andrew M, Sham P, Katz R, et al. (2003) The heritability of bipolar affective disorder and the genetic relationship to unipolar depression. Arch Gen Psychiatry 60: 497–502. - PubMed
    1. PGCBD Consortium (2011) Large-scale genome-wide association analysis of bipolar disorder identifies a new susceptibility locus near ODZ4. Nat Genet 43: 977–983. - PMC - PubMed
    1. Purcell SM, Wray NR, Stone JL, Visscher PM, O’Donovan MC, et al. (2009) Common polygenic variation contributes to risk of schizophrenia and bipolar disorder. Nature 460: 748–752. - PMC - PubMed
    1. Holmans P, Green EK, Pahwa JS, Ferreira MA, Purcell SM, et al. (2009) Gene ontology analysis of GWA study data sets provides insights into the biology of bipolar disorder. Am J Hum Genet 85: 13–24. - PMC - PubMed
    1. Rimol LM, Hartberg CB, Nesvag R, Fennema-Notestine C, Hagler DJ Jr, et al. (2010) Cortical thickness and subcortical volumes in schizophrenia and bipolar disorder. Biol Psychiatry 68: 41–50. - PubMed

Publication types

MeSH terms

Substances