. 2014 Jul 1;111(26):9555-60.
doi: 10.1073/pnas.1400604111. Epub 2014 Jun 18.

HBx induces hypomethylation of distal intragenic CpG islands required for active expression of developmental regulators

Affiliations

HBx induces hypomethylation of distal intragenic CpG islands required for active expression of developmental regulators

Sun-Min Lee et al. Proc Natl Acad Sci U S A. .

Abstract

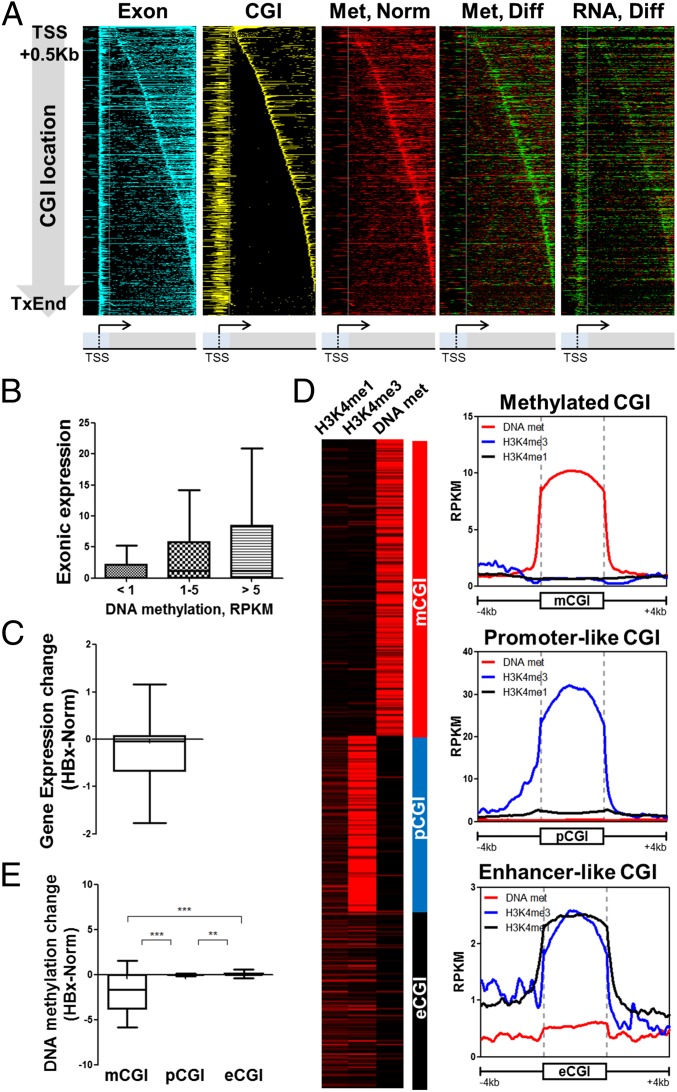
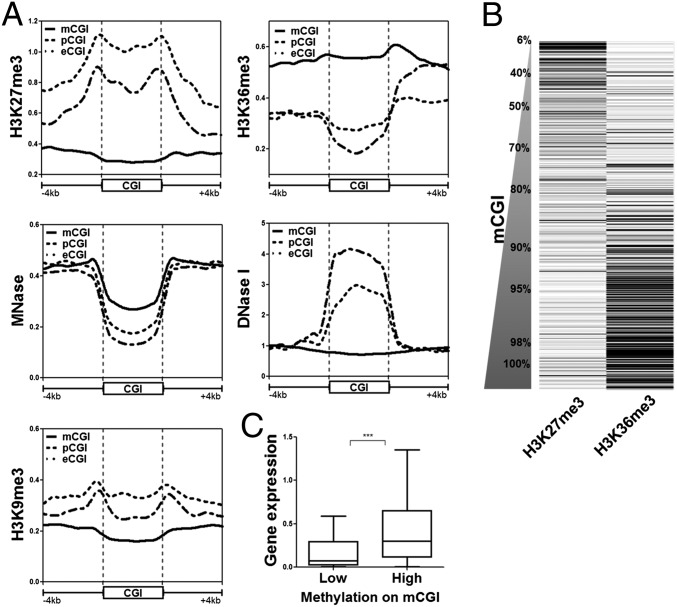
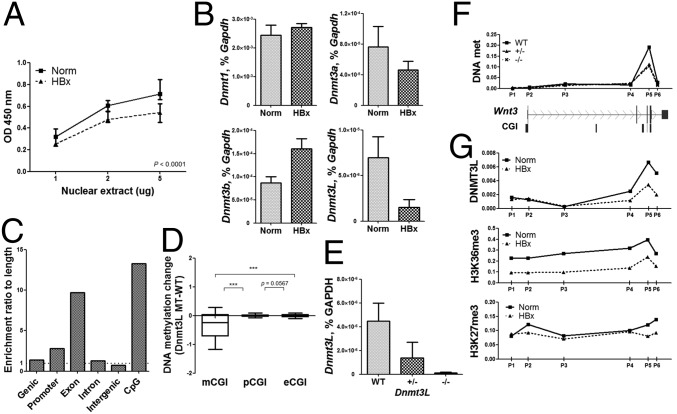
Epigenetic alterations caused by viral oncoproteins are strong initiation factors for cancer development, but their mechanisms are largely unknown. To identify the epigenetic effects of viral hepatitis B virus X (HBx) that lead to hepatocellular carcinoma (HCC), we profiled the DNA methylomes of normal and HBx transgenic mouse liver. Intriguingly, severe hypomethylation of intragenic CpG islands (CGIs) was observed in HBx liver before the full development of HCC. Normally, these CGIs were highly methylated (mCGIs) by the DNMT3L complex and marked with epigenetic signatures associated with active expression, such as H3K36me3. Hypomethylation of mCGI was caused by the downregulation of Dnmt3L and Dnmt3a due to HBx bound to their promoters, along with HDAC1. These events lead to the downregulation of many developmental regulators that could facilitate tumorigenesis. Here we provide an intriguing epigenetic regulation mediated by mCGI that is required for cell differentiation and describe a previously unidentified epigenetic role for HBx in promoting HCC development.

Keywords: DNA methylation; methylated CpG island; viral protein.


Conflict of interest statement

The authors declare no conflict of interest.

Figures

Fig. 1.
Fig. 1.
Global hypomethylation in the HBx-exposed liver. (A) Global comparisons of the four methylomes (Norm3 vs. HBx3, Norm13 vs. HBx13, Norm3 vs. Norm13, and HBx13 vs. HBx13). Scatter plots of RPKM at every 50 bp in the covered genome. The one dot represents methylation levels (RPKM) of the one site in windows of 50 bp of the mouse genome. The bold black lines show the Q-Q plots under different conditions for comparing two probability distributions by plotting their quantiles against each other. (B) The DMR in normal and HBx TG liver of 3- and 13-mo-old mice and the relative enrichment ratio to length of genomic elements. The expected frequency of variations was normalized by the length of the mouse genomic structures. (C) Differential methylation for supgrouped CGIs depends on their genomic locations in normal and HBx TG liver of 3-mo-old mice (HBx-Norm, RPKM). Differences were assessed with two-tailed t tests; *P < 0.01. (D) Average plot of DNA methylation on intragenic CGI and surrounding 4-kb regions (solid line, Norm; dashed line, HBx, RPKM) Each CGI was divided into 100 bins, and surrounding 4-kb regions were plotted at 40-bp resolution. (E) Intragenic CGIs consist of exonic and intronic regions. CGIs covering exons and introns were considered exonic. Box plot shows differential methylation for exonic vs. intronic CGIs (HBx-Norm, RPKM). Differences were assessed with a two-tailed t test; ***P < 0.0001.
Fig. 2.
Fig. 2.
Hypomethylation of distal exonic CGIs downregulates gene expression. (A) Heat maps display 647 individual genes associated with hypomethylated exonic CGIs are indicated by a single line. Promoter regions [−1 to +0.5 kb from transcription start site (TSS)] were divided into 30 bins, and gene-body regions (TSS + 0.5 kb to transcription end site) were divided into 100 bins (gray line indicates TSS + 0.5-kb site). Genes were arranged from top to bottom by CGI location in their gene body. Exon and CGI localization are represented as light blue and yellow colors, respectively (Exon, CGI). The red gradient indicates normal DNA methylation levels (Met, Norm). The heat map shows relative methylation or RNA level differences as increased (red) and decreased (green) (Met, Diff; RNA, Diff). (B) RNA expression levels on distal exons associated with CGIs according to their methylation levels. (C) Gene expression changes due to hypomethylation of distal exonic CGIs. Box plot of RPKM changes (HBx-Norm) from RNA-seq data. (D) Heat map based on K-means clustering method (K = 3). Intragenic CGIs can be divided into three subgroups based on the levels of H3K4me3 (ENCODE), H3K4me1 (ENCODE), and DNA methylation. Average plot of H3 lysine 4 or DNA methylation on each grouped CGI and the surrounding 4-kb regions. (black, H3K4me1; blue, H3K4me3; red, DNA met, RPKM). Each CGI and the surrounding 4-kb regions were divided into 100 bins. (E) Box plot shows differential methylation for mCGIs, pCGis, and eCGIs (HBx-Norm, RPKM). Differences were assessed with a two-tailed t test; ***P < 0.0001.
Fig. 3.
Fig. 3.
mCGIs: a distinct class of intragenic CGIs. (A) Average plot of H3K27me3, H3K36me3, MNase, DNase I, and H3K9me3 on intragenic CGI and surrounding 4-kb regions in the Gm12878 cell line from Human ENCODE (solid line, mCGI; dash-dot line, pCGI; dot line, eCGI, RPKM). Each CGI and surrounding 4-kb regions were divided into 100 bins. (B) H3K27me3 and H3K36me3 levels on mCGI antagonize each other and are dependent on DNA methylation level. mCGIs were lined up according to their methylation level, and the black gradient indicates the levels of H3K27me3 and H3K36me3 in the Gm12878 cell line. (C) Expression levels (RPKM from RNA-seq) of genes associated with the 100 lowest methylated mCGIs (low, average: 16.3%) and highest methylated 100 mCGIs (high, average: 100%). Differences were assessed with a t test; ***P < 0.0001.
Fig. 4.
Fig. 4.
DNMT3L is required for mCGI methylation. (A) DNMT activity assay from nuclear extracts of normal and HBx TG mouse liver. The amount of methylated DNA, which is proportional to enzyme activity, was colorimetrically quantified. Each bar represents the mean + SEM of n = 3 pools. (B) DNMT family expression was analyzed by RT-qPCR, and the relative expression was normalized to Gapdh. Each bar represents the mean + SEM of n = 3 pools. (C and D) Knockdown effects of Dnmt3L. MeDIP-seq data from embryonic day 8.5 wild-type and Dnmt3L −/+ mice (46). (C) Hypomethylated DMR relative enrichment ratio to genomic element length (Dnmt3L MT-WT). (D) Box plot shows differential methylation for grouped intragenic CGI (Dnmt3L MT-WT, RPKM); Differences were assessed with a two-tailed t test; ***P < 0.0001. (E and F) Knockdown effects of Dnmt3L. (E) Dnmt3L expression levels form 8-wk-old wild-type (47), Dnmt3L−/+, and Dnmt3L−/− mice. Dnmt3L expression in the liver was analyzed by RT-qPCR, and the relative expression was normalized to Gapdh. Each bar represents the mean + SEM of n = 4 pools. (F) Examples of plots are shown for DNA methylation and MIRA-qPCR binding profiles. The MIRA data represent IP values for each region’s relative ratio to the input. CGI locations are displayed in Wnt3 loci (solid line, Dnmt3L WT; dashed line, Dnmt3L+/−; dotted line, Dnmt3L−/−) The P5 indicates mCGI. (G) Examples of plots are shown for DNMT3L, H3K36me3, and H3K27me3 ChIP-qPCR binding profiles in Wnt3 loci. The ChIP data represent IP values for each region’s relative ratio to the input (solid line, Norm; dashed line, HBx). The P5 indicates hypomethylated mCGI in HBx TG liver.
Fig. 5.
Fig. 5.
Epigenetic repression of Dnmt3L by HBx. (A) Occupancies of HBx, HDAC1, H3Ace, H3K4me3, H3K27me3, and SP1 in Dnmt3L promoter (solid line, Norm; dashed line, HBx). The ChIP data represent IP values for each region’s relative ratio to the input. CGI locations are displayed in Dnmt3L loci (Dnmt3L -O, -S, and -AT). (B) HBx and DNMT3L expression levels in Mock and stably HBx-transfected HepG2 cells. Each bar represents the mean + SEM of n = 3 pools. (C) Occupancies of HBx and HDAC in the DNMT3L promoter (solid line, Mock; dashed line, HBx-flag). The ChIP data represent IP values for each region relative to the input. The P4 indicates the promoter region.

References

    1. Farazi PA, DePinho RA. Hepatocellular carcinoma pathogenesis: From genes to environment. Nat Rev Cancer. 2006;6(9):674–687. - PubMed
    1. Lavanchy D. Hepatitis B virus epidemiology, disease burden, treatment, and current and emerging prevention and control measures. J Viral Hepat. 2004;11(2):97–107. - PubMed
    1. Bowen DG, Walker CM. Adaptive immune responses in acute and chronic hepatitis C virus infection. Nature. 2005;436(7053):946–952. - PubMed
    1. Rapicetta M, Ferrari C, Levrero M. Viral determinants and host immune responses in the pathogenesis of HBV infection. J Med Virol. 2002;67(3):454–457. - PubMed
    1. Sung WK, et al. Genome-wide survey of recurrent HBV integration in hepatocellular carcinoma. Nat Genet. 2012;44(7):765–769. - PubMed

Publication types

MeSH terms

Associated data