. 2014 Jun 19:5:4099.
doi: 10.1038/ncomms5099.

Adipocytes arise from multiple lineages that are heterogeneously and dynamically distributed

Affiliations

Adipocytes arise from multiple lineages that are heterogeneously and dynamically distributed

Joan Sanchez-Gurmaches et al. Nat Commun. .

Abstract

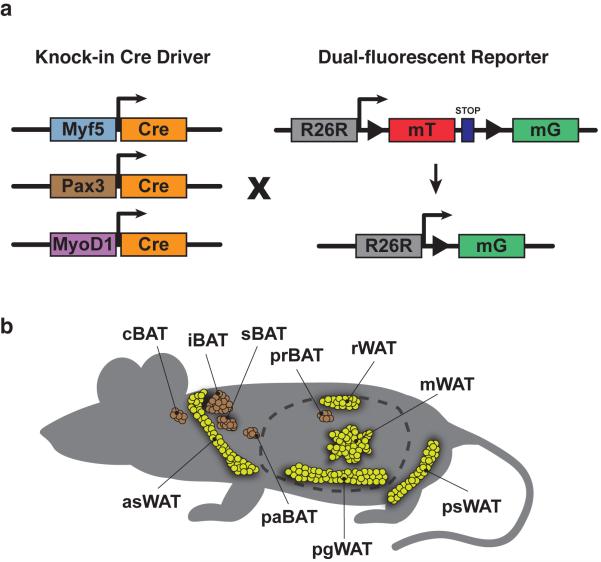
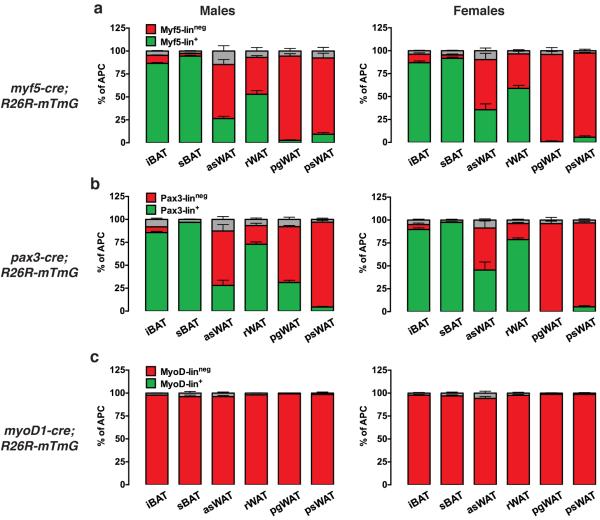
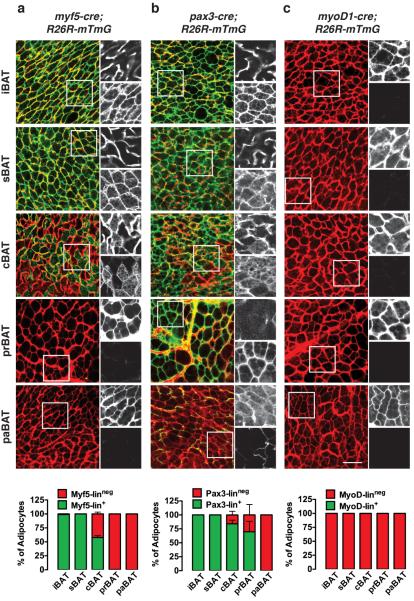
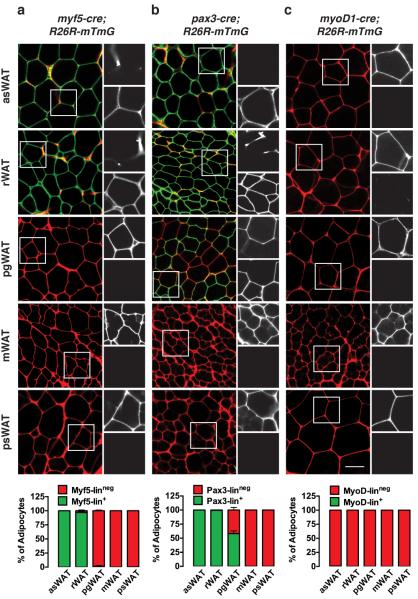
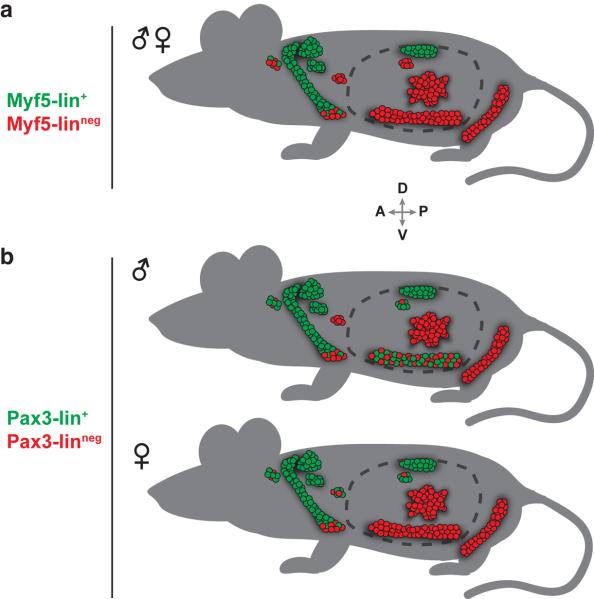
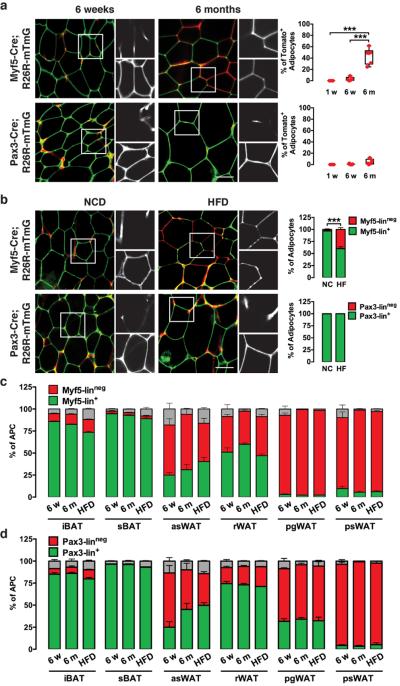
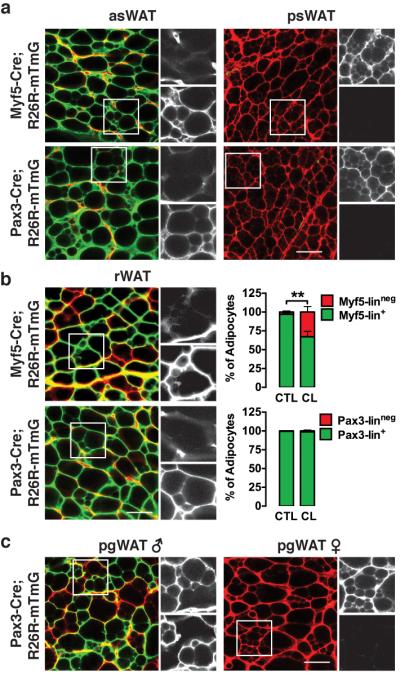
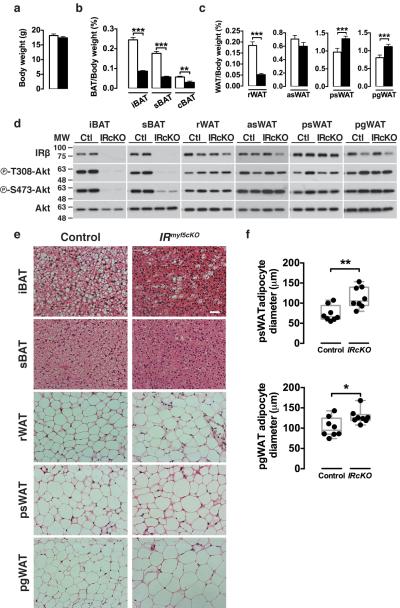
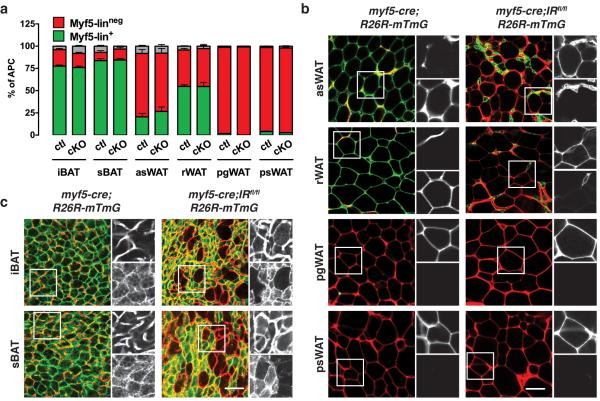
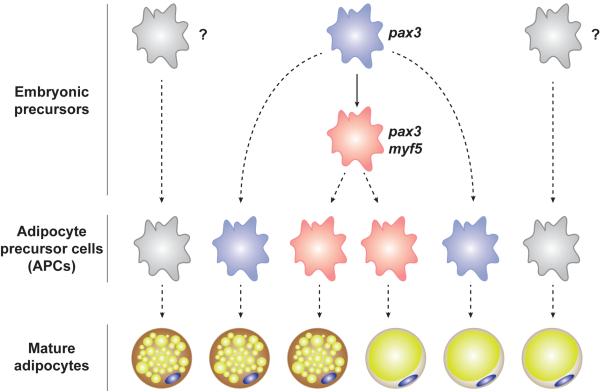
Adipose tissue development is poorly understood. Here we use a lineage-tracing strategy optimal for adipocytes to provide evidence that Myf5 precursors are not the exclusive source of brown adipocytes and contribute more to the mature white and brite adipocyte populations than previously thought. Moreover, Myf5-lineage distribution in adipose tissue changes in response to modifiable and non-modifiable factors. We also find that the Pax3 lineage largely overlaps with the Myf5 lineage in brown fat and subcutaneous white fat, but exhibits gender-linked divergence in visceral white fat while the MyoD1 lineage does not give rise to any adipocytes. Finally, by deleting insulin receptor beta in the Myf5 lineage, we provide in vivo evidence that the insulin receptor is essential for adipogenesis and that adipocyte lineages have plasticity. These data establish a conceptual framework for adipose tissue development and could explain body fat patterning variations in healthy and lipodystrophic or obese humans.


Figures

Figure 1
Figure 1. Lineage Tracing Strategy
(a) Cre drivers and fluorescent reporter system used in this study. Each Cre driver is a knock-in allele meaning Cre activity is indicative of the activity of the endogenous promoter. (b) Anatomical disposition of BAT and WAT depots examined in this study. Interscapular BAT (iBAT, subsapular BAT (sBAT), cervical BAT (cBAT), periaortic BAT (prBAT), perirenal BAT (prBAT), anterior-subcutaneous WAT (asWAT), posterior-subcutaneous WAT (psWAT), retroperitoneal WAT (rWAT), perigonadal WT (pgWAT) and mesenteric WAT (mWAT) depots are indicated.
Figure 2
Figure 2. Lineage tracing of adipocyte precursor cells (APCs)
(a–c) Number of mTFP+ and mGFP+ APCs isolated from each of the indicated depots from 6 week old myf5-cre,R26R-mTmG (a), pax3-cre,R26R-mTmG (b) and myod1-cre,R26R-mTmG mice (c). Data from males and females are shown separately (n=3–5; mean+S.E.M). A small number of cells in each case that could not be distinguished are indicated in grey
Figure 3
Figure 3. The Myf5 and Pax3 lineages are heterogeneously distributed in BAT
(a) Representative images of whole-mount preparations of the indicated BATs of 6 week old myf5-cre;R26R-mTmG male mice. The mTFP and mGFP channels within the boxed inset are shown enlarged to the right of each panel (top = mTFP; bottom = mGFP). The number of mTFP+ and mGFP+ mature brown adipocytes in each depot is indicated in a graph at the bottom of each column (n=3–8 mice; mean+S.E.M). (b) Same as (a) except using pax3;R26R-mTmG male mice. (n=3–8; mean+S.E.M). (c) Same as (a) & (b) except using myod1;R26R-mTmG male mice. (n=3–4; mean+S.E.M). Scale bar= 50 μm.
Figure 4
Figure 4. Most dorsal-anterior white adipocytes trace with Myf5-Cre and Pax3-Cre
(a) Representative images of whole-mount preparations of the indicated WATs of 6 week old myf5;R26R-mTmG male mice. The mTFP and mGFP channels within the boxed inset are shown enlarged to the right of each panel (top = mTFP; bottom = mGFP). The number of mTFP+ and mGFP+ mature brown adipocytes in each depot is indicated in a graph at the bottom of each column (n=3–5 mice; mean+S.E.M). (b) Same as (a) except using pax3;R26R-mTmG male mice. (n=3–8 mice; mean+S.E.M). (c) Same as (a) & (b) except using myod1;R26R-mTmG male mice. (n=4 mice; mean+S.E.M). Scale bar= 50 μm.
Figure 5
Figure 5. Model depicting the Myf5-Cre and Pax3-Cre lineage tracing patterns
(a) Anatomical distribution of Myf5-Cre traced adipocytes in BAT and WAT (refer to Figure 1b for depot identity). The distribution is not significantly different between males and females. Anterior (A), posterior (P), dorsal (D), and ventral (V) are indicated. (b) Anatomical distribution of Pax3-Cre traced adipocytes in BAT and WAT. Male and female distribution patterns are shown separately because of the gender-linked variation in paBAT and pgWAT.
Figure 6
Figure 6. The Myf5-lineage distribution is dynamic
(a) Representative images of whole-mount rWAT from myf5-cre;R26R-mTmG and pax3-cre;R26R-mTmG males at 6-weeks and 6-months of age. Quantification of mTFP+ (Myf5-Linneg) adipocytes at 1-week, 6-weeks and 6-months of age is shown at the right. Each dot represents one mouse (n=3–6; mean+S.E.M; ***, p<0.001; ANOVA test). (b) Four weeks old myf5-cre;R26R-mTmG and pax3-cre;R26R-mTmG males were fed a HFD (45% of calories from fat) for 2 weeks and whole-mount preparations of rWAT were imaged at 6-weeks of age. Bar graphs (right) are the quantifications of mTFP+ and mGFP+ mature rWAT adipocytes in mice fed the normal chow diet (NC) or high fat diet (HF) (n=5–10 mice for myf5-cre; n=3–8 mice for pax3-cre. mean+S.E.M; ***, p<0.001; t-test). (c) Number of mTFP+ and mGFP+ APCs isolated from each of the indicated depots from myf5-cre;R26R-mTmG at 6-weeks of age (6w), 6-months of age (6m) and from 6 weeks of age after 2 weeks high fat diet (HFD). A small number of cells in each case that could not be distinguished are indicated in grey (n=3–4; mean+S.E.M). (d) Same as (c) except using pax3-cre;R26R-mTmG mice (n=3–6; mean+S.E.M). Scale bar= 50 μm.
Figure 7
Figure 7. Brite adipocytes are Myf5/Pax3-lineage positive or negative depending upon the depot
(a) Representative images of whole-mount preparations of asWAT and psWAT of 6-week old male myf5-cre;R26R-mTmG (top) and pax3-cre;R26R-mTmG (bottom) mice that were treated with CL316,243 for one week. (b) Representative images of whole-mount preparations of rWAT from male myf5-cre;R26R-mTmG (top) and pax3-cre;R26R-mTmG (bottom) mice treated with CL316,243 for one week starting at 5 weeks of age. (Right) Quantification of mTFP+ and mGFP+ mature adipocytes in the rWAT of control (CTL) and treated (CL) mice is shown (n=4–5 mice for myf5-cre; n=4–8 mice for pax3-cre. mean+S.E.M; **, p<0.01; t-test). (c) Representative images of whole-mount preparations of male and female pgWAT of 6-week old pax3-cre;R26R-mTmG mice that were treated with CL316,243 for one week. Scale bar= 50 μm.
Figure 8
Figure 8. IRmyf5cKO mice have altered body fat distribution
(a) Total body weight of IRmyf5cKO and littermate control mice at 6-weeks of age (n=14 mice). (b) BAT mass relative to body weight for the indicated depots at 6-weeks of age (n=14 mice; mean+S.E.M; **, p<0.01***, p<0.001; t-test). (c) WAT mass relative to body weight for the indicated depots at 6-weeks of age (n=14 mice; mean+S.E.M; **, p<0.01***, p<0.001; t-test). (d) Western blots of the indicated tissues from IRmyf5cKO and littermate control mice at 6-weeks of age. (e) H&E images of the indicated BATs and WATs from IRmyf5cKO and control mice at 6-weeks of age. (f) Cell size quantification of mature adipocytes from psWAT and pgWAT of IRmyf5cKO and littermate control mice at 6-weeks of age (n=8 mice; boxplot indicating maximum, minimum, media and all data points; *, p<0.05; **, p<0.01; t-test).
Figure 9
Figure 9. Adipocyte lineages have plasticity
(a) Number of mTFP+ and mGFP+ APCs isolated from each of the indicated depots from 6 week old male IRmyf5cKO-R26R-mTmG and control mice (n=10 males; mean+S.E.M). (b–c) Representative images of whole-mount preparations of the indicated WATs (b) and BATs (c) of 6 week old IRmyf5cKO-R26R-mTmG mice. Scale bar= 50 μm.
Figure 10
Figure 10. A revised model of adipocyte origins based on Pax3-Cre and Myf5-Cre lineage tracing to mature adipocytes
Embryonic precursors expressing Pax3-Cre and Myf5-Cre give rise to a subset of APCs and mature brown and white adipocytes. A subset of brown and white adipocytes also arises from Pax3-Cre+ precursors that do not express Myf5-Cre. The origin of Pax3-Cre and Myf5-Cre negative adipocytes is not yet clear. Dotted lines are used to indicate lineages because the intermediate stages are poorly understood. Note that the knock-in Cre drivers used in this study are indicative of the activity of the endogenous promoters.

Comment in

References

    1. Cinti S. The adipose organ. Prostaglandins, leukotrienes, and essential fatty acids. 2005;73:9–15. - PubMed
    1. Gesta S, Tseng YH, Kahn CR. Developmental origin of fat: tracking obesity to its source. Cell. 2007;131:242–256. - PubMed
    1. Cinti S. The adipose organ at a glance. Disease models & mechanisms. 2012;5:588–594. - PMC - PubMed
    1. Berry R, Rodeheffer MS. Characterization of the adipocyte cellular lineage in vivo. Nat Cell Biol. 2013;15:302–308. - PMC - PubMed
    1. Herbst KL. Rare adipose disorders (RADs) masquerading as obesity. Acta pharmacologica Sinica. 2012;33:155–172. - PMC - PubMed

Publication types