. 2014 Sep 1;88(17):9842-63.
doi: 10.1128/JVI.01562-14. Epub 2014 Jun 18.

Analysis of human rotaviruses from a single location over an 18-year time span suggests that protein coadaption influences gene constellations

Affiliations

Analysis of human rotaviruses from a single location over an 18-year time span suggests that protein coadaption influences gene constellations

Shu Zhang et al. J Virol. .

Abstract

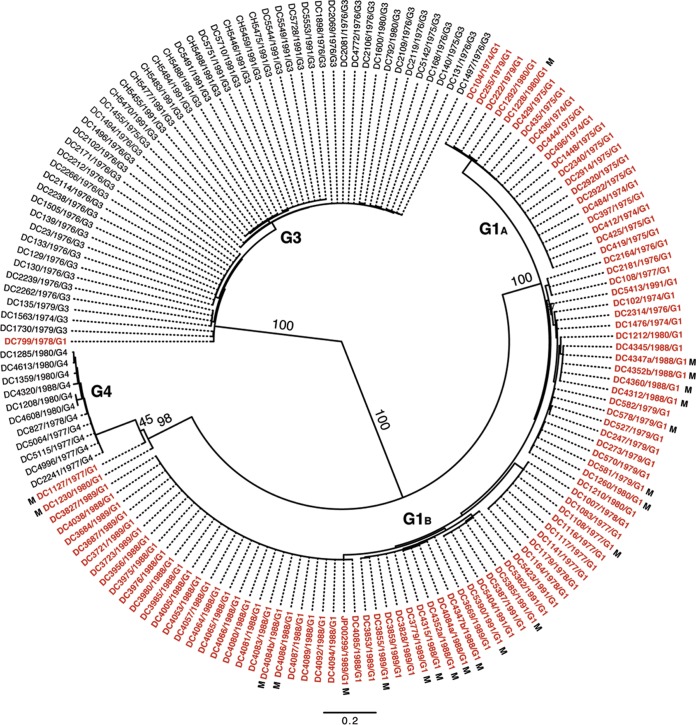
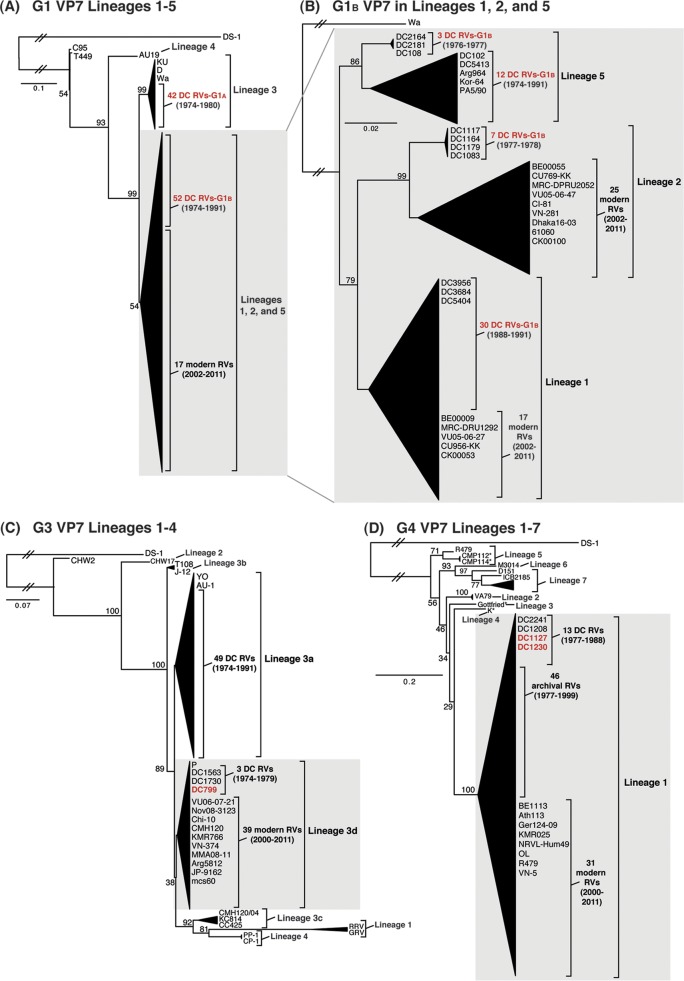
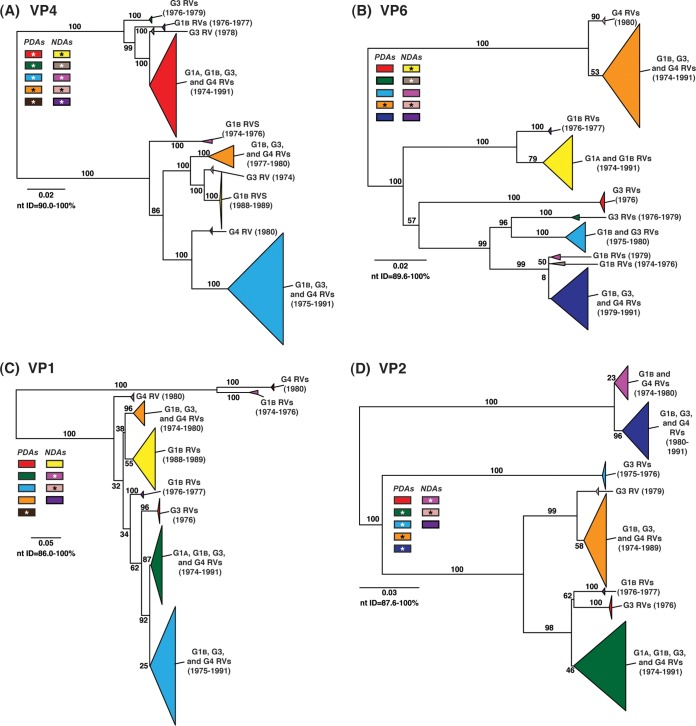
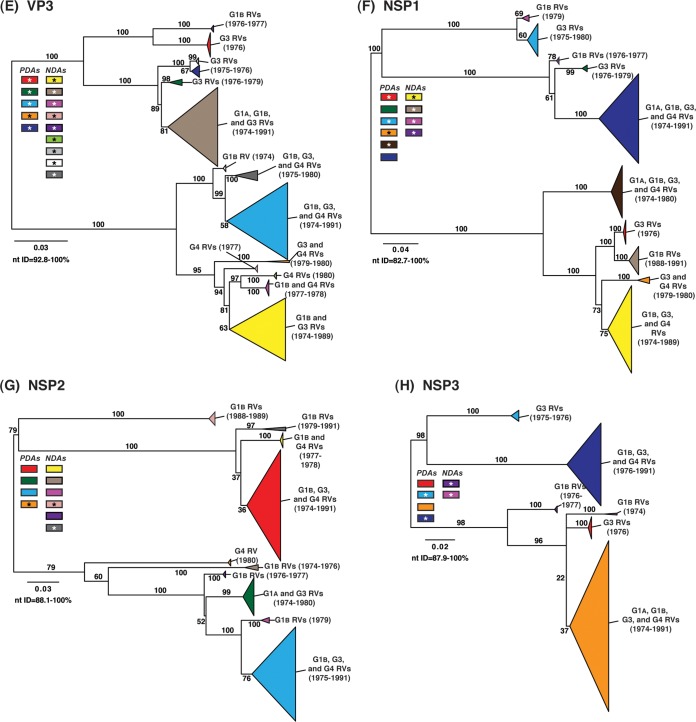
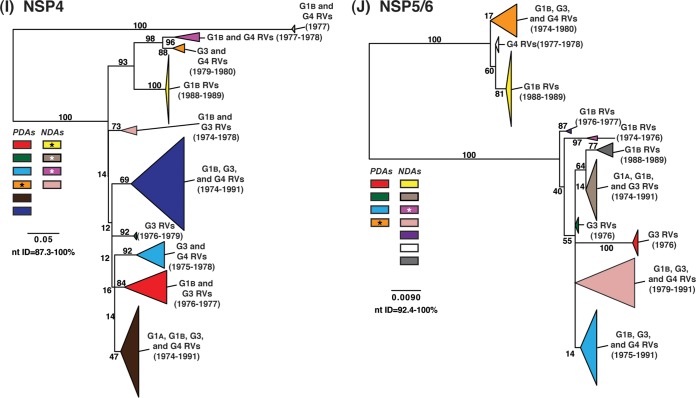
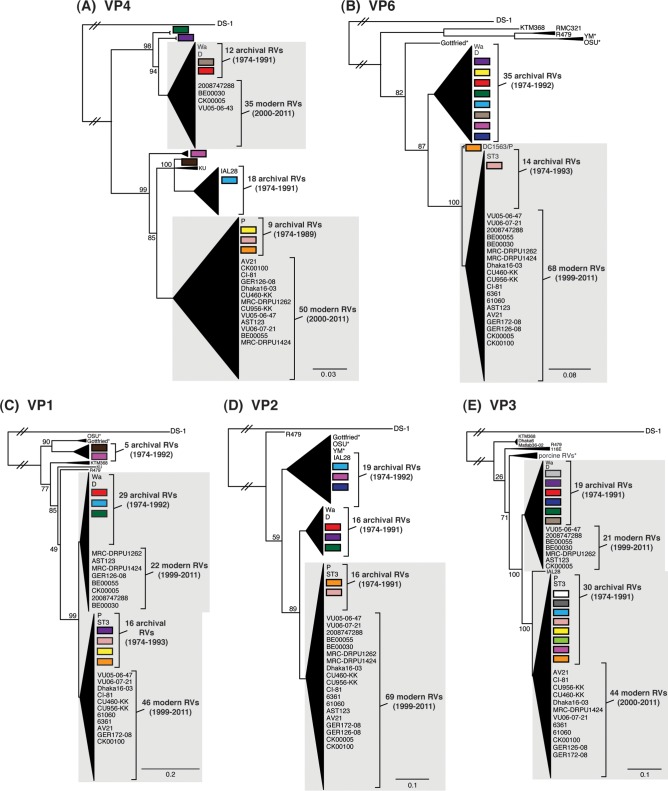
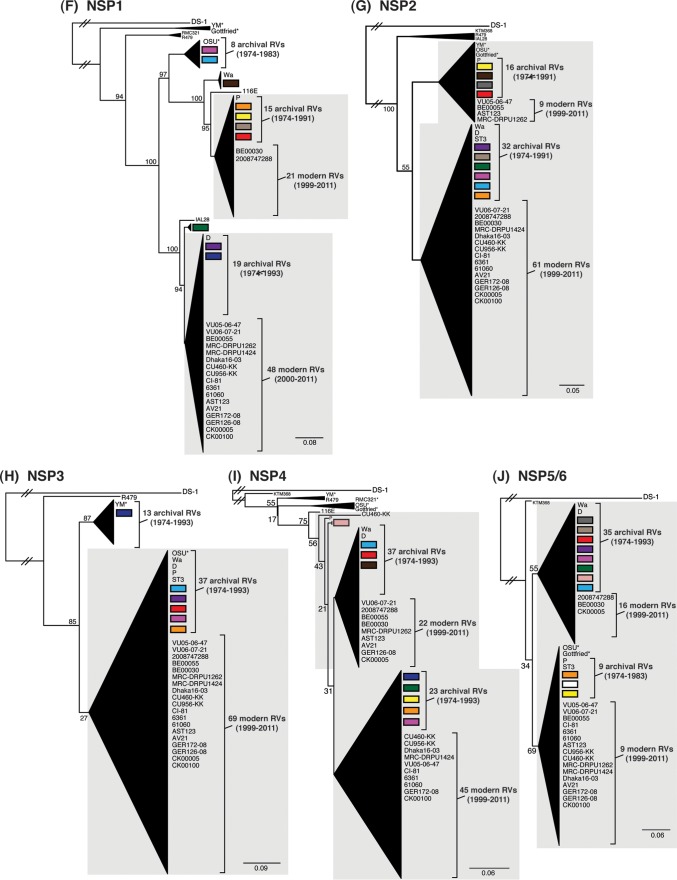
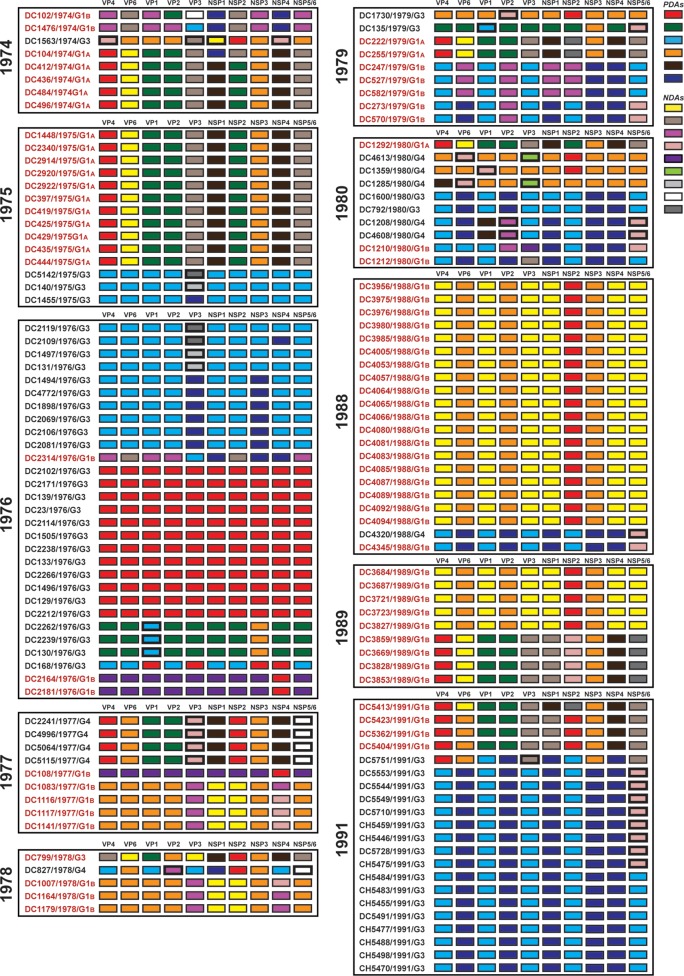
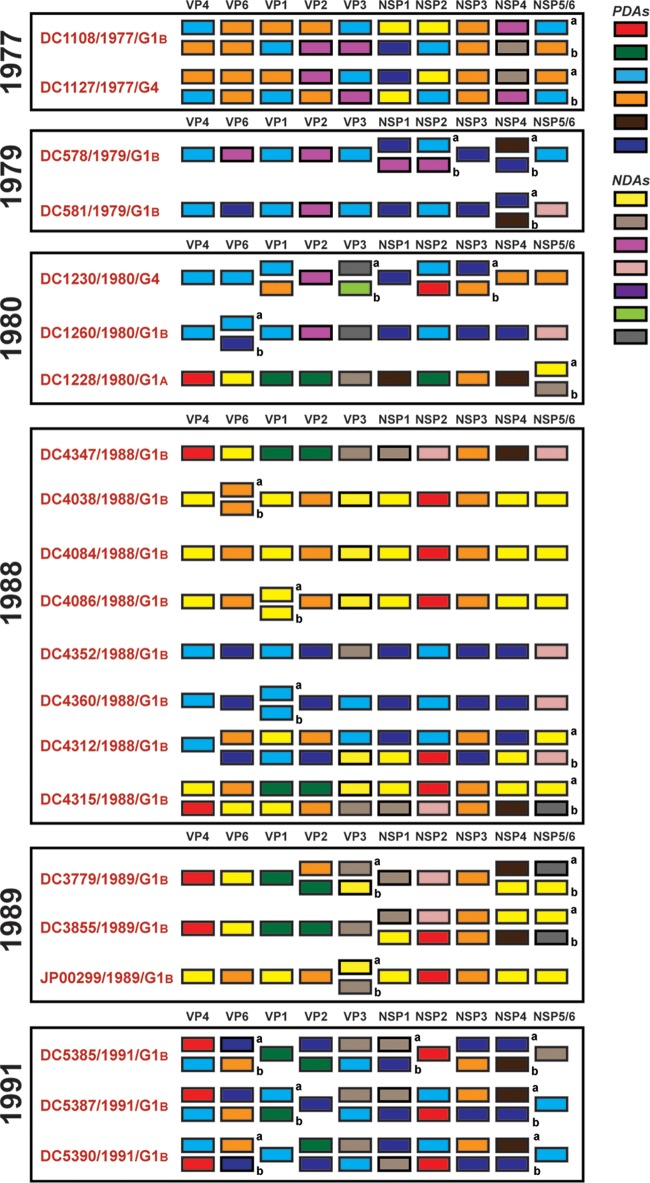
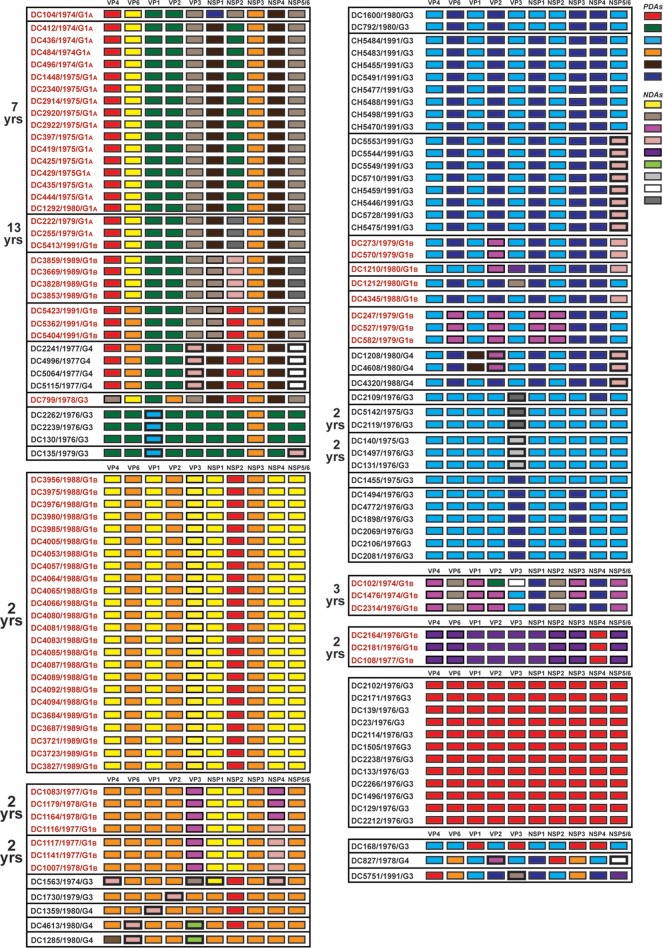
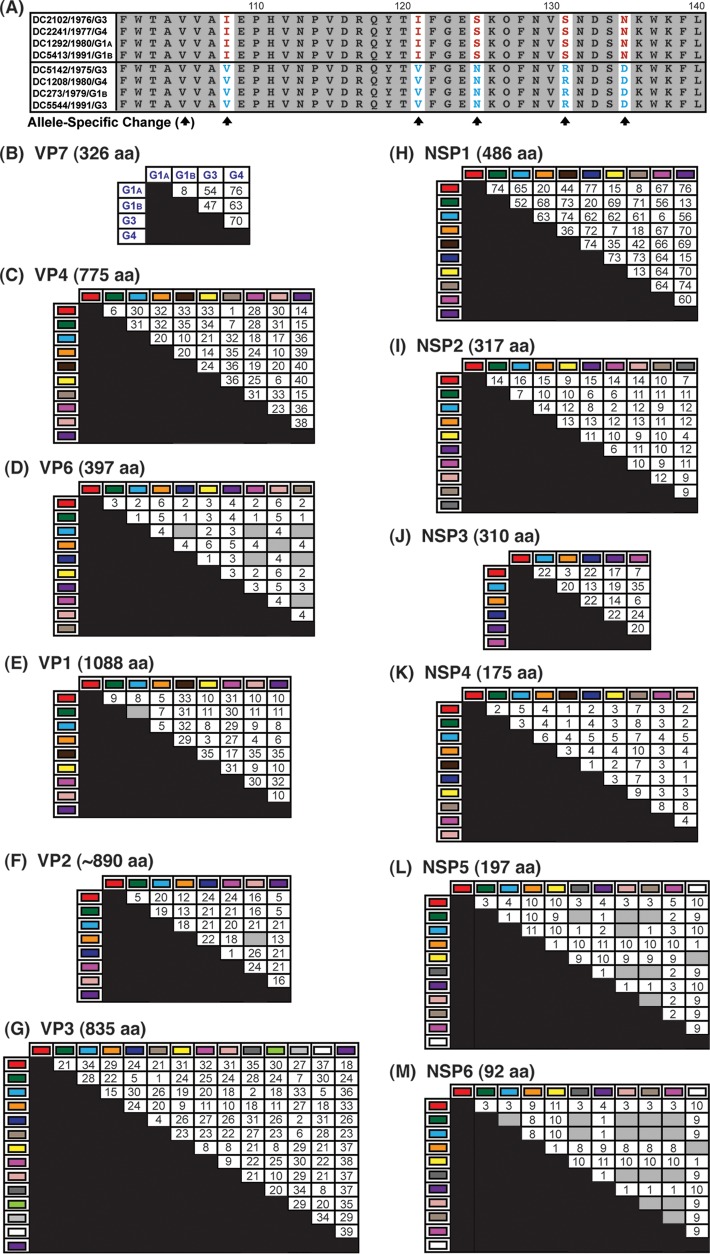
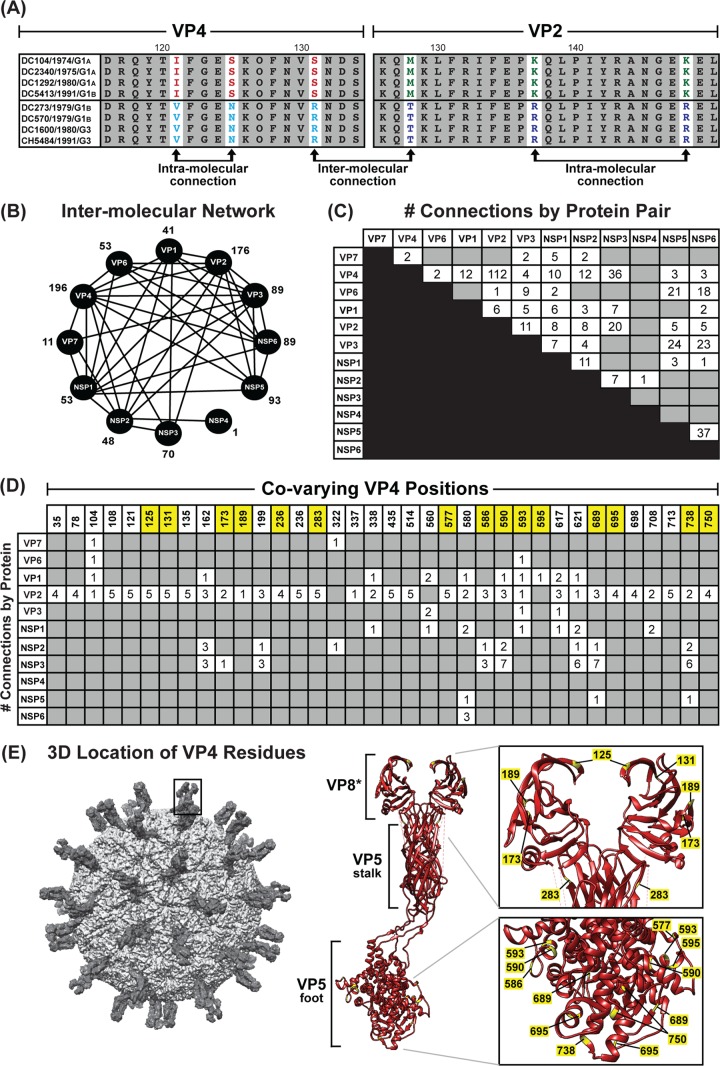
Rotaviruses (RVs) are 11-segmented, double-stranded RNA viruses that cause severe gastroenteritis in children. In addition to an error-prone genome replication mechanism, RVs can increase their genetic diversity by reassorting genes during host coinfection. Such exchanges allow RVs to acquire advantageous genes and adapt in the face of selective pressures. However, reassortment may also impose fitness costs if it unlinks genes/proteins that have accumulated compensatory, coadaptive mutations and that operate best when kept together. To better understand human RV evolutionary dynamics, we analyzed the genome sequences of 135 strains (genotype G1/G3/G4-P[8]-I1-C1-R1-A1-N1-T1-E1-H1) that were collected at a single location in Washington, DC, during the years 1974 to 1991. Intragenotypic phylogenetic trees were constructed for each viral gene using the nucleotide sequences, thereby defining novel allele level gene constellations (GCs) and illuminating putative reassortment events. The results showed that RVs with distinct GCs cocirculated during the vast majority of the collection years and that some of these GCs persisted in the community unchanged by reassortment. To investigate the influence of protein coadaptation on GC maintenance, we performed a mutual information-based analysis of the concatenated amino acid sequences and identified an extensive covariance network. Unexpectedly, amino acid covariation was highest between VP4 and VP2, which are structural components of the RV virion that are not thought to directly interact. These results suggest that GCs may be influenced by the selective constraints placed on functionally coadapted, albeit noninteracting, viral proteins. This work raises important questions about mutation-reassortment interplay and its impact on human RV evolution.

Importance: Rotaviruses are devastating human pathogens that cause severe diarrhea and kill >450,000 children each year. The virus can evolve by accumulating mutations and by acquiring new genes from other strains via a process called reassortment. However, little is known about the relationship between mutation accumulation and gene reassortment for rotaviruses and how it impacts viral evolution. In this study, we analyzed the genome sequences of human strains found in clinical fecal specimens that were collected at a single hospital over an 18-year time span. We found that many rotaviruses did not reassort their genes but instead maintained them as specific sets (i.e., constellations). By analyzing the encoded proteins, we discovered concurrent amino acid changes among them, which suggests that they are functionally coadapted to operate best when kept together. This study increases our understanding of how rotaviruses evolve over time in the human population.


Figures

FIG 1
FIG 1
Inter- and intragenotypic diversity of the VP7 genes of the DC RVs. The maximum-likelihood phylogenetic tree was created using nucleotides 49 to 1020 of all 159 available DC RV VP7 gene sequences. The tree is midpoint rooted and shown in radial format. Bootstrap values are shown as percentages for key nodes, and horizontal branch lengths are drawn to scale (nucleotide substitutions per base). Four major groupings representing G1 (alleles G1A and G1B), G3, and G4 genotypes are labeled. Individual strain names are shown at the tips of the branches, along with their year of isolation and G type determined by PCR-ELISA. The VP7 gene sequences deduced in references and are shown in black, while those deduced in the current study are shown in red. VP7 gene sequences from mixed (M) fecal specimens are indicated.
FIG 2
FIG 2
Comparison of the archival DC RV VP7 genes to those of other strains. Maximum-likelihood intragenotypic phylogenetic trees were constructed using the VP7 gene nucleotide sequences. All horizontal branch lengths are drawn to scale (nucleotide substitutions per base), bootstrap values are shown as percentages for key nodes, and lineages/sublineages are labeled. The relative locations of archival and modern RV genes in each tree are indicated, and select RV strains are listed by name. Strains sequenced in this study are shown in red. (A and B) G1 VP7 gene trees were created using nucleotides 73 to 970. (C) G3 VP7 gene tree created using nucleotides 1 to 988. (D) G4 VP7 gene tree created using nucleotides 61 to 807.
FIG 3
FIG 3
Intragenotypic diversity of the DC RV VP1 to VP4, VP6, and NSP1 to NSP5/6 genes. Maximum-likelihood intragenotypic phylogenetic trees were constructed for each gene and are midpoint rooted. The following nucleotides were used for each gene: VP4 gene, nucleotides 10 to 2337 (A); VP6 gene, nucleotides 30 to 1217 (B); VP1 gene, nucleotides 20 to 3242 (C); VP2 gene, nucleotides 139 to 2650 (D); VP3 gene, nucleotides 57 to 2556 (E); NSP1 gene, nucleotides 162 to 1491 (F); NSP2 gene, nucleotides 49 to 1000 (G); NSP3 gene, nucleotides 35 to 967 (H); NSP4 gene, nucleotides 42 to 569 (I); and NSP5/6 gene, nucleotides 22 to 615 (J). Horizontal branch lengths are drawn to scale (nucleotide substitutions per base), and bootstrap values are shown as percentages for key nodes. Monophyletic lineages representing allele groupings were collapsed (triangles) and colored coded. PDAs from McDonald et al. (25, 26) are colored red, green, cyan, orange, navy, or brown. NDAs are colored yellow, tan, dark pink, pale pink, purple, light green, light gray, white, or dark gray. Alleles defined for each gene are summarized as rectangles, with those having bootstrap support of >70% are indicated with asterisks. The G genotype and years of circulation for RVs with that particular allele are noted.
FIG 3
FIG 3
Intragenotypic diversity of the DC RV VP1 to VP4, VP6, and NSP1 to NSP5/6 genes. Maximum-likelihood intragenotypic phylogenetic trees were constructed for each gene and are midpoint rooted. The following nucleotides were used for each gene: VP4 gene, nucleotides 10 to 2337 (A); VP6 gene, nucleotides 30 to 1217 (B); VP1 gene, nucleotides 20 to 3242 (C); VP2 gene, nucleotides 139 to 2650 (D); VP3 gene, nucleotides 57 to 2556 (E); NSP1 gene, nucleotides 162 to 1491 (F); NSP2 gene, nucleotides 49 to 1000 (G); NSP3 gene, nucleotides 35 to 967 (H); NSP4 gene, nucleotides 42 to 569 (I); and NSP5/6 gene, nucleotides 22 to 615 (J). Horizontal branch lengths are drawn to scale (nucleotide substitutions per base), and bootstrap values are shown as percentages for key nodes. Monophyletic lineages representing allele groupings were collapsed (triangles) and colored coded. PDAs from McDonald et al. (25, 26) are colored red, green, cyan, orange, navy, or brown. NDAs are colored yellow, tan, dark pink, pale pink, purple, light green, light gray, white, or dark gray. Alleles defined for each gene are summarized as rectangles, with those having bootstrap support of >70% are indicated with asterisks. The G genotype and years of circulation for RVs with that particular allele are noted.
FIG 4
FIG 4
Comparison of the VP1 to VP4, VP6, and NSP1 to NSP5/6 genes from the DC RVs to those of other strains. Maximum-likelihood intragenotypic phylogenetic trees were constructed for each gene and are outgroup rooted to the genes of strain DS-1. The following nucleotides were used for each gene: VP4 gene, nucleotides 10 to 2337 (A); VP6 gene, nucleotides 24 to 1217 (B); VP1 gene, nucleotides 19 to 3267 (C); VP2 gene, nucleotides 155 to 2701 (D); VP3 gene, nucleotides 50 to 2557 (E); NSP1 gene, nucleotides 32 to 1492 (F); NSP2 gene, nucleotides 47 to 1000 (G); NSP3 gene, nucleotides 35 to 967 (H); NSP4 gene, nucleotides 42 to 569 (I); and NSP5/6 gene, nucleotides 21 to 614 (J). Horizontal branch lengths are drawn to scale (nucleotide substitutions per base), bootstrap values are shown as percentages for key nodes, and monophyletic groupings were collapsed (triangles). The relative locations of the subgenotype alleles defined for the DC RVs in the trees are shown as colored rectangles. The relative locations of archival and modern RV genes in each tree are indicated, and select RV strains are listed. The asterisks indicate animal RV strains.
FIG 4
FIG 4
Comparison of the VP1 to VP4, VP6, and NSP1 to NSP5/6 genes from the DC RVs to those of other strains. Maximum-likelihood intragenotypic phylogenetic trees were constructed for each gene and are outgroup rooted to the genes of strain DS-1. The following nucleotides were used for each gene: VP4 gene, nucleotides 10 to 2337 (A); VP6 gene, nucleotides 24 to 1217 (B); VP1 gene, nucleotides 19 to 3267 (C); VP2 gene, nucleotides 155 to 2701 (D); VP3 gene, nucleotides 50 to 2557 (E); NSP1 gene, nucleotides 32 to 1492 (F); NSP2 gene, nucleotides 47 to 1000 (G); NSP3 gene, nucleotides 35 to 967 (H); NSP4 gene, nucleotides 42 to 569 (I); and NSP5/6 gene, nucleotides 21 to 614 (J). Horizontal branch lengths are drawn to scale (nucleotide substitutions per base), bootstrap values are shown as percentages for key nodes, and monophyletic groupings were collapsed (triangles). The relative locations of the subgenotype alleles defined for the DC RVs in the trees are shown as colored rectangles. The relative locations of archival and modern RV genes in each tree are indicated, and select RV strains are listed. The asterisks indicate animal RV strains.
FIG 5
FIG 5
Allele level GCs of DC RVs from nonmixed specimens viewed by year of collection. The schematic illustrates the color coding of each gene for each sequenced DC RV strain based on the phylogenies shown in Fig. 1 and 3. The protein encoded by each viral gene (excluding VP7) is shown at the top. The strain name, its year of isolation, and its G genotype are shown on the left of the corresponding genome. PDAs from McDonald et al. (25, 26) are represented by rectangles colored red, green, cyan, orange, navy, or brown. NDAs are represented by rectangles colored yellow, tan, dark pink, pale pink, purple, light green, light gray, white, or dark gray. Allele designations of G3P[8] and G4P[8] DC RVs that were redefined based on the results of this study are outlined in thick lines. Strains circulating in the same year are boxed.
FIG 6
FIG 6
Allele level GCs of DC RVs from mixed specimens viewed by year of collection. The schematic illustrates the color coding of each gene for each sequenced DC RV strain based on the phylogenies shown in Fig. 1 and 3. The protein encoded by each viral gene (excluding VP7) is shown at the top. The strain name, its year of isolation, and its G genotype are shown on the left of the corresponding genome. PDAs from McDonald et al. (25, 26) are represented by rectangles colored red, green, cyan, orange, navy, or brown. NDAs are represented by rectangles colored yellow, tan, dark pink, pale pink, purple, light green, gray, white, or dark gray. Strains circulating in the same year are boxed. Lowercase letters (a and b) indicate the two alleles found for homologous genes. DC4347 and DC4352 had two different VP7 gene sequences (Fig. 1).
FIG 7
FIG 7
Allele level GCs of DC RVs from nonmixed specimens ordered by similarities. The schematic illustrates the color coding of each gene for each sequenced DC RV strain based on the phylogenies shown in Fig. 1 and 3. The protein encoded by each viral gene (excluding VP7) is shown at the top. The strain name, its year of isolation, and its G genotype are shown on the left of the corresponding genome. PDAs from McDonald et al. (25, 26) are represented by rectangles colored red, green, cyan, orange, navy, or brown. NDAs are represented by rectangles colored yellow, tan, dark pink, pale pink, purple, light green, light gray, white, or dark gray. Allele designations of G3P[8] and G4P[8] DC RVs that were redefined based on the results of this study are outlined in thick lines. Strains with similar allele level gene constellations are boxed. Allele level GCs are separated by lines. The numbers of years for which viruses with persistent allele level GCs were found are shown.
FIG 8
FIG 8
Allele-specific amino acid changes in DC RV proteins. (A) Schematic showing red versus cyan VP4 (residues 101 to 140) as an example of the strategy used to identify allele-specific changes (arrows). (B to M) Positions with both complete intra-allelic amino acid conservation and complete interallelic amino acid variations were quantitated and are shown in the matrices. The total length of each protein in amino acids (aa) is shown above the corresponding matrix. For VP7, the G1A and G1B alleles were also compared to genotype G3 and G4 proteins. The gray boxes indicate that no allele-specific changes were identified.
FIG 9
FIG 9
Amino acid covariation among DC RV proteins. (A) Schematic showing an example of correlated amino acid changes within (intramolecular connections) and between (intermolecular connection) two different viral proteins (VP4 residues 116 to 131 versus VP2 residues 126 to 150). (B) Intermolecular covariation network. Each viral protein is represented by a black circle. Lines connecting the circles indicate that the two proteins showed intermolecularly covarying amino acid positions with mutual information scores of >64.9. The total number of intermolecular connections made by each protein is shown next to the circle. (C) Matrix showing the number of intermolecular connections for each protein pair with mutual information scores of >64.9. The gray boxes indicate that no connections were found. (D) Matrix showing the covarying amino acid positions of VP4 and the number of connections each position makes with another viral protein. VP4 positions highlighted in yellow have codons with dN/dS ratios of >1. (E) The RV virion is shown on the far left, with a VP4 spike outlined. The atomic structure of VP4 is shown in ribbon representation (PDB number 3IYU) in the middle, with VP8* and VP5 stalk/foot subdomains labeled. Residues in yellow are those from panel C. A magnified view of the VP8* and VP5 foot subdomains is shown on the right, with the positions of amino acids labeled.

Similar articles

Cited by

References

    1. Estes MK, Kapikian AZ. 2007. Rotaviruses and their replication, p 1917–1974 In Fields BN, Knipe DM, Howley PM, Griffen DE, Lamb RA, Martin MA, Roizman B, Straus SE. (ed), Fields virology, 5th ed. Lippincott Williams and Wilkins, Philadelphia, PA
    1. Gouvea V, Brantly M. 1995. Is rotavirus a population of reassortants? Trends Microbiol. 3:159–162. 10.1016/S0966-842X(00)88908-8 - DOI - PubMed
    1. Lauring AS, Frydman J, Andino R. 2013. The role of mutational robustness in RNA virus evolution. Nat. Rev. Microbiol. 11:327–336. 10.1038/nrmicro3003 - DOI - PMC - PubMed
    1. Chao L. 1997. Evolution of sex and the molecular clock in RNA viruses. Gene 205:301–308. 10.1016/S0378-1119(97)00405-8 - DOI - PubMed
    1. Domingo E, Escarmis C, Sevilla N, Moya A, Elena SF, Quer J, Novella IS, Holland JJ. 1996. Basic concepts in RNA virus evolution. FASEB J. 10:859–864 - PubMed

Publication types

LinkOut - more resources