. 2014 Sep;13(9):2513-26.
doi: 10.1074/mcp.M113.031591. Epub 2014 Jun 17.

Accurate proteome-wide label-free quantification by delayed normalization and maximal peptide ratio extraction, termed MaxLFQ

Affiliations

Accurate proteome-wide label-free quantification by delayed normalization and maximal peptide ratio extraction, termed MaxLFQ

Jürgen Cox et al. Mol Cell Proteomics. 2014 Sep.

Abstract

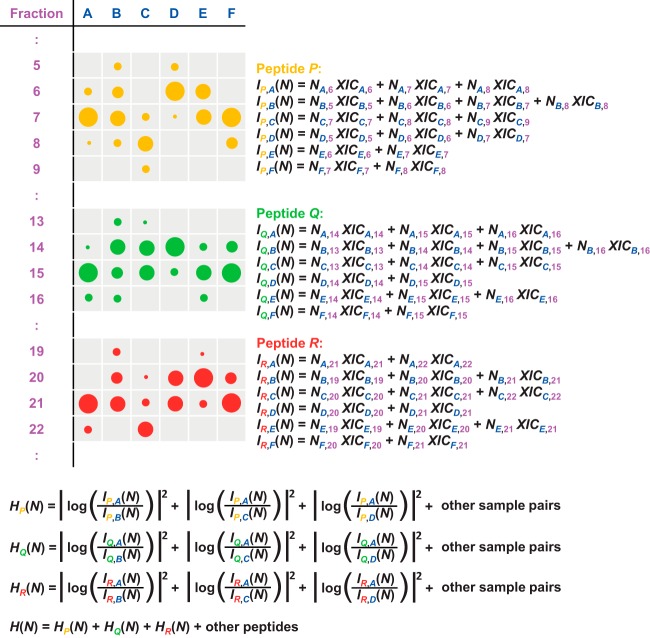
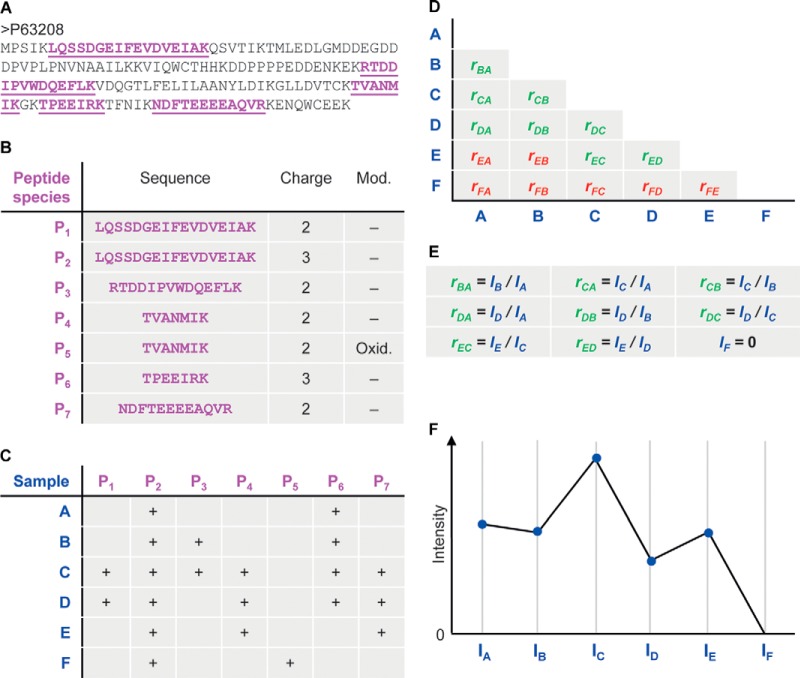
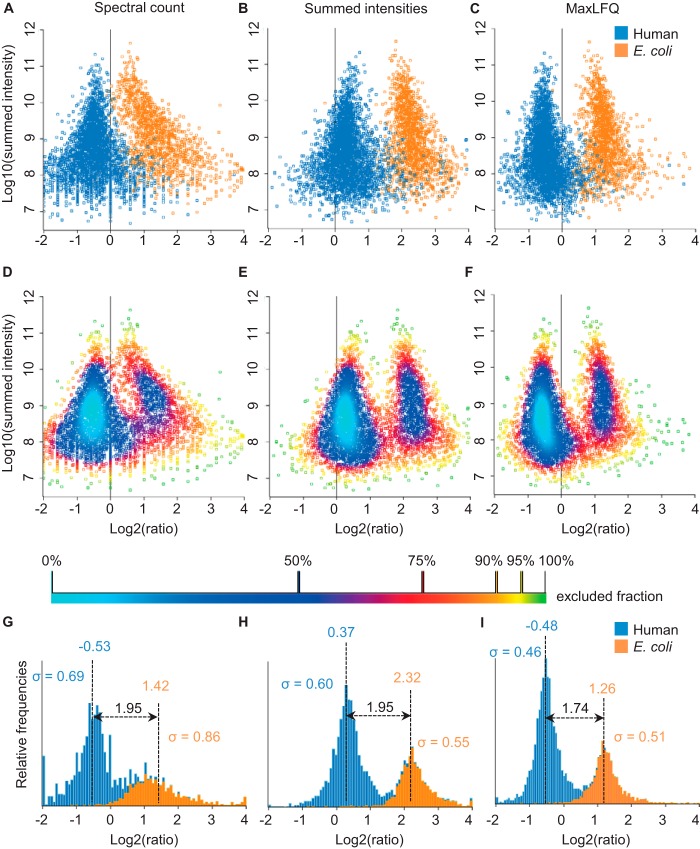
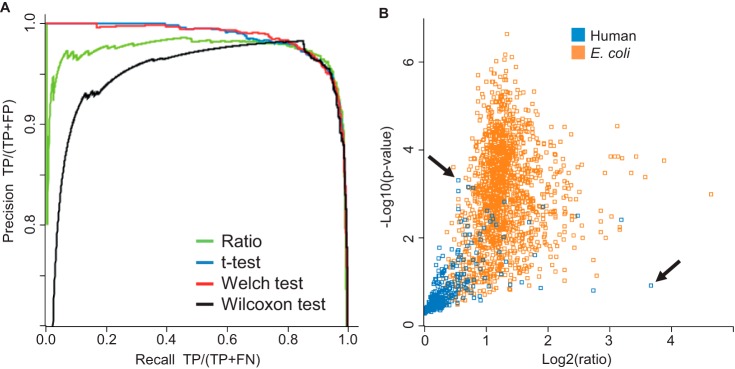
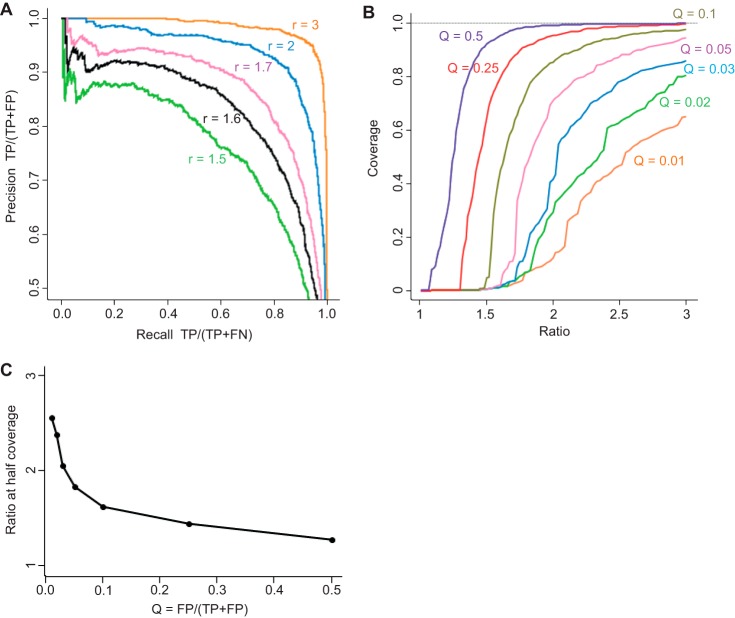
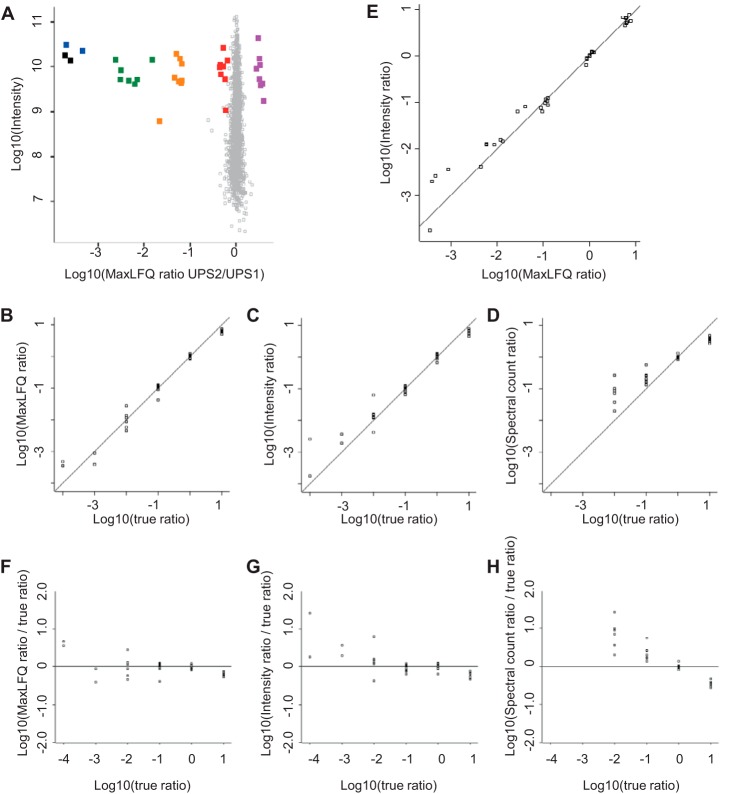
Protein quantification without isotopic labels has been a long-standing interest in the proteomics field. However, accurate and robust proteome-wide quantification with label-free approaches remains a challenge. We developed a new intensity determination and normalization procedure called MaxLFQ that is fully compatible with any peptide or protein separation prior to LC-MS analysis. Protein abundance profiles are assembled using the maximum possible information from MS signals, given that the presence of quantifiable peptides varies from sample to sample. For a benchmark dataset with two proteomes mixed at known ratios, we accurately detected the mixing ratio over the entire protein expression range, with greater precision for abundant proteins. The significance of individual label-free quantifications was obtained via a t test approach. For a second benchmark dataset, we accurately quantify fold changes over several orders of magnitude, a task that is challenging with label-based methods. MaxLFQ is a generic label-free quantification technology that is readily applicable to many biological questions; it is compatible with standard statistical analysis workflows, and it has been validated in many and diverse biological projects. Our algorithms can handle very large experiments of 500+ samples in a manageable computing time. It is implemented in the freely available MaxQuant computational proteomics platform and works completely seamlessly at the click of a button.


Figures

Fig. 1.
Fig. 1.
Schematic construction of the function H(N) to be minimized in order to determine the normalization coefficients for each LC-MS/MS run. Intensity distributions of three peptides (orange, green, and red) over samples and fractions are indicated by the sizes of the circles. H(N) is the sum of the squared logarithmic changes in all samples (A, B, C, …) for all peptides (P, Q, R, …). When using the fast normalization option, only a subset of all possible pairs of samples will be considered.
Fig. 2.
Fig. 2.
Algorithm constructing protein intensity profiles for one protein from its peptide signals. A, an exemplary protein sequence. Peptides with an XIC-based quantification are indicated in magenta. B, the five peptide sequences give rise to seven peptide species. For this purpose, a peptide species is a distinct combination of peptide sequence, modification state, and charge, each of which has its own occurrence pattern over the different samples. C, occurrence matrix of peptide species in the six samples. D, matrix of pair-wise sample protein ratios calculated from the peptide XIC ratios. Valid/invalid ratios are colored in green/red based on a configurable minimum ratio count cut-off. If a sample has no valid ratio with any other sample, like sample F, the intensity will be set to zero. E, system of equations that needs to be solved for the protein abundance profile. F, the resulting protein abundance profile for one protein. The absolute scale is adapted to match the summed-up raw peptide intensities.
Fig. 3.
Fig. 3.
Quantification results for the proteome benchmark dataset. Replicate groups were filtered for two out of three valid values and averaged, and the log ratios of the E. coli (orange)/human (blue) 3:1 versus 1:1 samples were plotted against the logarithm of summed peptide intensities from the 1:1 sample as a proxy for absolute protein abundance. A, quantification using spectral counts. B, quantification using summed peptide intensities. C, quantification using MaxLFQ. D–F, same as A–C, but colored using density estimation. G, H, histograms of the ratio distributions of human and E. coli proteins obtained using the different quantification methods.
Fig. 4.
Fig. 4.
Statistical significance of protein regulation. A, precision-recall curves based on four different strategies. TP, true positives; FP, false positives; FN, false negatives. B, the Welch modified t test p value is plotted logarithmically against the ratio. The vast majority of E. coli proteins (orange) have p values better than 0.05, indicating significant regulation. An extremely small number of human proteins (blue) appear to have a large ratio and significant p value (false positives for quantification). The arrows indicate that the best strategy is to select significantly regulated proteins by t test p value (first false positive after hundreds of correct hits with better p values) rather than fold change (first false positive after three correct hits with higher fold change).
Fig. 5.
Fig. 5.
Statistical significance of small protein ratios. A, precision-recall curves based on a t test on a set of ratios that were simulated in silico by shrinking the experimental ratio of three. B, ratio-coverage plots for these simulated ratios at a set of fixed proportions of false discoveries among the discoveries (Q). One can see a drop in coverage around a given ratio, which is particularly steep for large values of Q. C, simulated ratio at which one achieves half-coverage plotted against the value of Q.
Fig. 6.
Fig. 6.
Quantification results for the dynamic range benchmark dataset. Replicate groups were filtered for three out of four valid values and averaged. A, log ratios of the UPS2 versus UPS1 samples plotted against the logarithm of summed peptide intensities from the UPS1 sample as a proxy for absolute protein abundance. E. coli proteins are plotted in gray and form a narrow population centered on zero. UPS proteins are color-coded by their abundance groups in the UPS2 sample. B–D, to compare the ratio readout against the true ratio, we shifted the population of UPS proteins that were present in UPS1 and UPS2 in equimolar amounts to 1:1 and plotted the log ratio obtained from (B) MaxLFQ, (C) summed intensities, and (D) spectral counts against the log of the true ratio. E, log intensity ratio plotted against log MaxLFQ ratios. F–H, data from B–D plotted as the deviation from the true ratio. Spectral counts show a clear underestimation of ratios across the entire dynamic range and lose 2 orders of magnitude. Summed intensities and MaxLFQ show increased scatter toward ratios of several orders of magnitude. Summed intensities show some degree of systematic underestimation of large ratios, which was not observed for MaxLFQ ratios.

References

    1. Aebersold R., Mann M. (2003) Mass spectrometry-based proteomics. Nature 422, 198–207 - PubMed
    1. Ong S. E., Mann M. (2005) Mass spectrometry-based proteomics turns quantitative. Nat. Chem. Biol. 1, 252–262 - PubMed
    1. Bantscheff M., Schirle M., Sweetman G., Rick J., Kuster B. (2007) Quantitative mass spectrometry in proteomics: a critical review. Anal. Bioanal. Chem. 389, 1017–1031 - PubMed
    1. Cox J., Mann M. (2007) Is proteomics the new genomics? Cell 130, 395–398 - PubMed
    1. Altelaar A. F., Munoz J., Heck A. J. (2013) Next-generation proteomics: towards an integrative view of proteome dynamics. Nat. Rev. Genet. 14, 35–48 - PubMed

Publication types