. 2014 Jul 15;193(2):571-9.
doi: 10.4049/jimmunol.1400043. Epub 2014 Jun 18.

TCR affinity and tolerance mechanisms converge to shape T cell diabetogenic potential

Affiliations

TCR affinity and tolerance mechanisms converge to shape T cell diabetogenic potential

Maria Bettini et al. J Immunol. .

Abstract

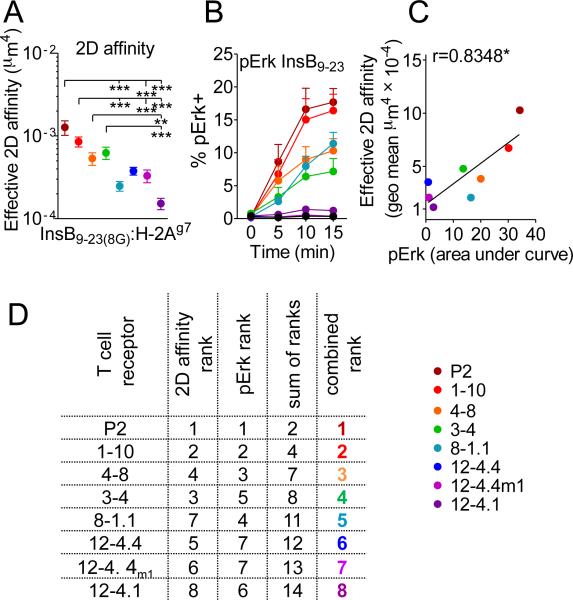
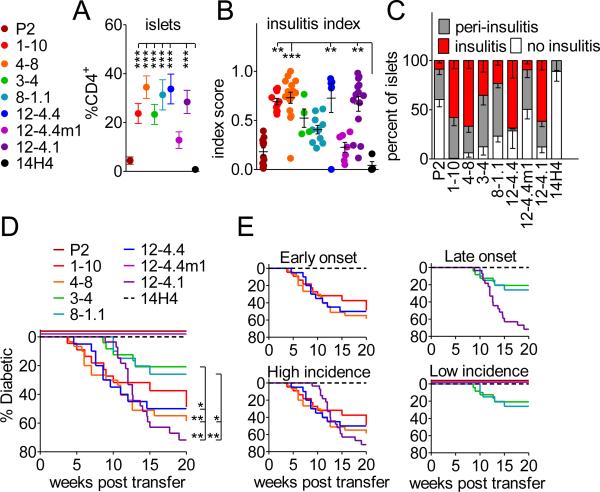
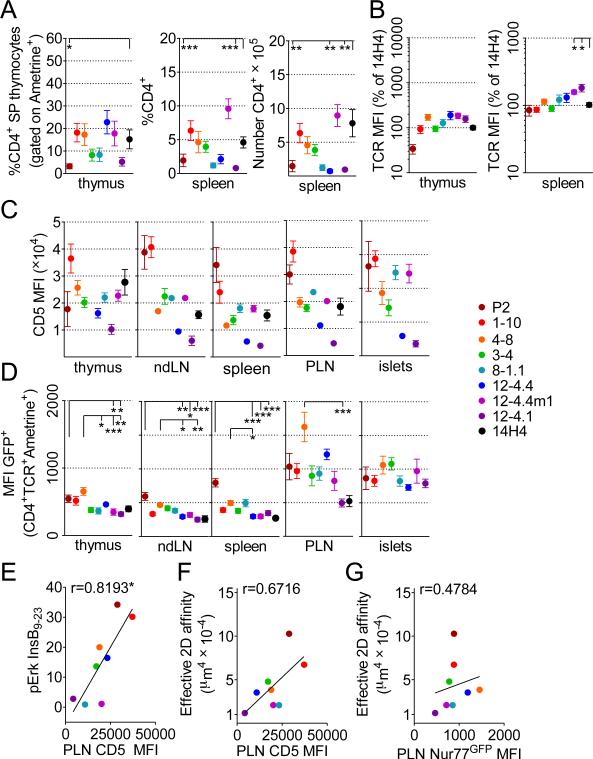
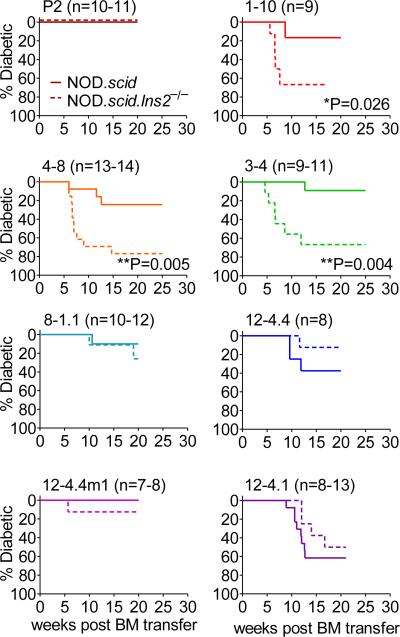
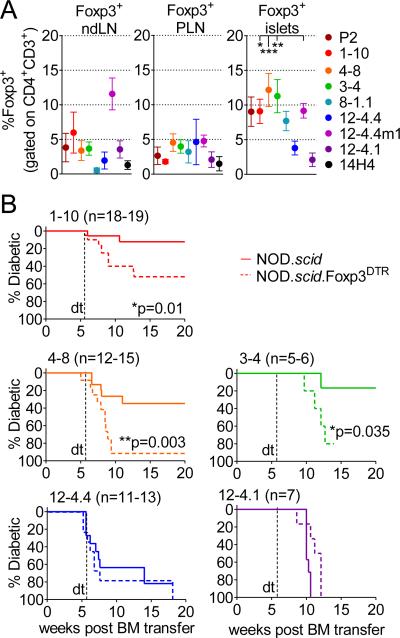
Autoreactive T cells infiltrating the target organ can possess a broad TCR affinity range. However, the extent to which such biophysical parameters contribute to T cell pathogenic potential remains unclear. In this study, we selected eight InsB9-23-specific TCRs cloned from CD4(+) islet-infiltrating T cells that possessed a relatively broad range of TCR affinity to generate NOD TCR retrogenic mice. These TCRs exhibited a range of two-dimensional affinities (∼ 10(-4)-10(-3) μm(4)) that correlated with functional readouts and responsiveness to activation in vivo. Surprisingly, both higher and lower affinity TCRs could mediate potent insulitis and autoimmune diabetes, suggesting that TCR affinity does not exclusively dictate or correlate with diabetogenic potential. Both central and peripheral tolerance mechanisms selectively impinge on the diabetogenic potential of high-affinity TCRs, mitigating their pathogenicity. Thus, TCR affinity and multiple tolerance mechanisms converge to shape and broaden the diabetogenic T cell repertoire, potentially complicating efforts to induce broad, long-term tolerance.


Figures

FIGURE 1
FIGURE 1. Functional and biophysical affinity measurements for InsB9-23-specific TCRs
(A) 2D TCR biophysical affinity was measured as described previously (Huang J. et. al. 2010) for retrogenic CD4+ T cell lines. At least two unique cell lines were used to calculate 2D affinity on separate days; each dot represents geometric mean of affinities measured for at least 12 different T cells, error bars represent SEM. (B) TCRCD4+ 4G4 hybridoma was transfected with TCRs, sorted on comparable TCR expression level, and stimulated with InsB9-23. pErk response was used as a readout of functional affinity. An average of at least four separate experiments generated with three separate cells lines is depicted. Error bars represent SEM. (C) Correlation between TCR 2D affinity and pErk expression (calculated as an area under the line from panel B). (D) Ranking of the TCRs based on combination of pErk and 2D affinity.
FIGURE 2
FIGURE 2. High and low affinity TCRs are able to accumulate in the pancreas and induce spontaneous diabetes development
(A) Frequencies of insulin specific T cells in the infiltrated pancreatic islets were obtained from analysis of TCR retrogenic mice 7-8 weeks post bone marrow transfer. An average of at least 10 mice from 4 separate experiments is shown. Error bars represent SEM. (B and C) Histological assessment of insulitis in insulin TCR retrogenic mice at 8-9 weeks post bone marrow transfer. (D) TCR retrogenic mice were monitored for spontaneous diabetes development (n ≥ 20 mice per group).
FIGURE 3
FIGURE 3. CD5 and Nur77GFP expression on insulin specific CD4+ T cells in the thymus, peripheral lymphoid organs and infiltrated pancreatic islets
(A) Frequencies of CD4+ SP in thyme, and frequency and number of CD4+ T cells in the spleens of TCR retrogenic mice analyzed at 7-8 weeks post bone marrow transfer. An average of at least 9 mice and 4 separate experiments is shown. Error bars represent SEM. (B) Relative TCR expression levels were calculated based on average TCR expression for 14H4 in the same experiment. At least 8 separate mice from 4 separate experiments were analyzed. (C) CD5 expression by insulin specific T cells in the thymus, spleen and infiltrated pancreatic islets. An average of at least 7 mice from 3 separate experiments is shown. Error bars represent SEM. (D) Nur77GFP expression by insulin specific T cells in the thymus, peripheral lymphoid organs and infiltrated pancreatic islets. An average of at least 7 mice from 3 different experiments is shown. Error bars represent SEM. (E) Correlation between transfectant pErk response to WT peptide calculated from Fig. 1B and average CD5 expression in the draining lymph nodes. (F) Correlation between 2D affinity and average CD5 expression in the draining lymph nodes. (G) Correlation between 2D TCR affinity and Nur77GFP.
FIGURE 4
FIGURE 4. In vitro readout of TCR stimulation via Nur77GFP reporter
Insulin specific T cell lines developed from Nur77GFP TCR retrogenic mice were stimulated for 24 hrs in vitro with WT peptide, whole protein (insulin), or NOD islets in combination with exogenous splenocytes; after which cells were analyzed for Nur77GFP expression as a readout of TCR activation. (A) Representative flow plots for cell line stimulation with insulin. (B) GFP upregulation in response to stimuli. (C) Correlation between transfectant pErk activation and T cell Nur77GFP expression in response to WT peptide. (D) Correlations between 2D affinity, CD5 expression in PLN, and Nur77GFP expression compared to T cell response to naturally processed insulin.
FIGURE 5
FIGURE 5. Accelerated diabetes development in TCR retrogenic mice on the Ins2−/− background is more dramatic for high affinity TCRs
TCR retrogenic NOD.scid bone marrow was transferred to NOD.scid or NOD.scid.Ins2−/− recipients. Frequency of peripheral CD4+Ametrine+TCR+ T cells was used to verify equal reconstitution between groups. TCR retrogenic mice were monitored for diabetes development. At least 7 mice per group were monitored for spontaneous diabetes development.
FIGURE 6
FIGURE 6. Deletion of Foxp3+ CD4+ T cells in insulin TCR retrogenic mice leads to accelerated diabetes development in higher affinity TCRs
(A) Foxp3+ T cells accumulate in the pancreatic islets of TCR retrogenic mice: frequency of Foxp3+ T cells was assessed in lymph nodes and pancreatic islets of TCR retrogenic mice 8 weeks post bone marrow transfer. Analysis shown is for at least 5 mice per group. (B) TCR retrogenic mice were generated with NOD.scid or NOD.scid.Foxp3DTR+ bone marrow. Frequency of peripheral CD4+Ametrine+TCR+ T cells was used to verify equal reconstitution between groups. Mice were treated with diphtheria toxin twice a week starting at 5.5 weeks post bone marrow transfer and monitored for diabetes development.

References

    1. Davis MM, Boniface JJ, Reich Z, Lyons D, Hampl J, Arden B, Chien Y. Ligand recognition by alpha beta T cell receptors. Annu Rev Immunol. 1998;16:523–544. - PubMed
    1. Williams CB, Engle DL, Kersh GJ, Michael White J, Allen PM. A kinetic threshold between negative and positive selection based on the longevity of the T cell receptor-ligand complex. J Exp Med. 1999;189:1531–1544. - PMC - PubMed
    1. Cole DK, Pumphrey NJ, Boulter JM, Sami M, Bell JI, Gostick E, Price DA, Gao GF, Sewell AK, Jakobsen BK. Human TCR-binding affinity is governed by MHC class restriction. J Immunol. 2007;178:5727–5734. - PubMed
    1. van der Merwe PA, Davis SJ. Molecular interactions mediating T cell antigen recognition. Annu Rev Immunol. 2003;21:659–684. - PubMed
    1. Palmer E, Naeher D. Nat Rev Immunol. 2009;Affinity threshold for thymic selection through a T-cell receptor-co-receptor zipper.9:207–213. - PubMed

Publication types

MeSH terms