. 2014 Oct;192(5):765-73.
doi: 10.1007/s00408-014-9608-3. Epub 2014 Jun 19.

Developing a reference of normal lung sounds in healthy Peruvian children

Affiliations

Developing a reference of normal lung sounds in healthy Peruvian children

Laura E Ellington et al. Lung. 2014 Oct.

Abstract

Purpose: Lung auscultation has long been a standard of care for the diagnosis of respiratory diseases. Recent advances in electronic auscultation and signal processing have yet to find clinical acceptance; however, computerized lung sound analysis may be ideal for pediatric populations in settings, where skilled healthcare providers are commonly unavailable. We described features of normal lung sounds in young children using a novel signal processing approach to lay a foundation for identifying pathologic respiratory sounds.

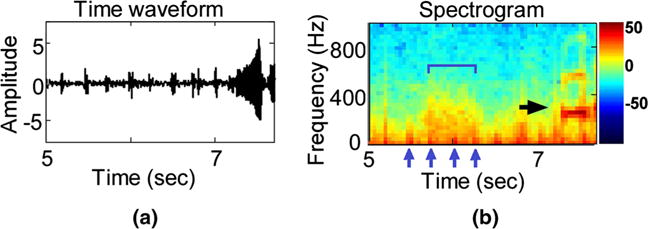
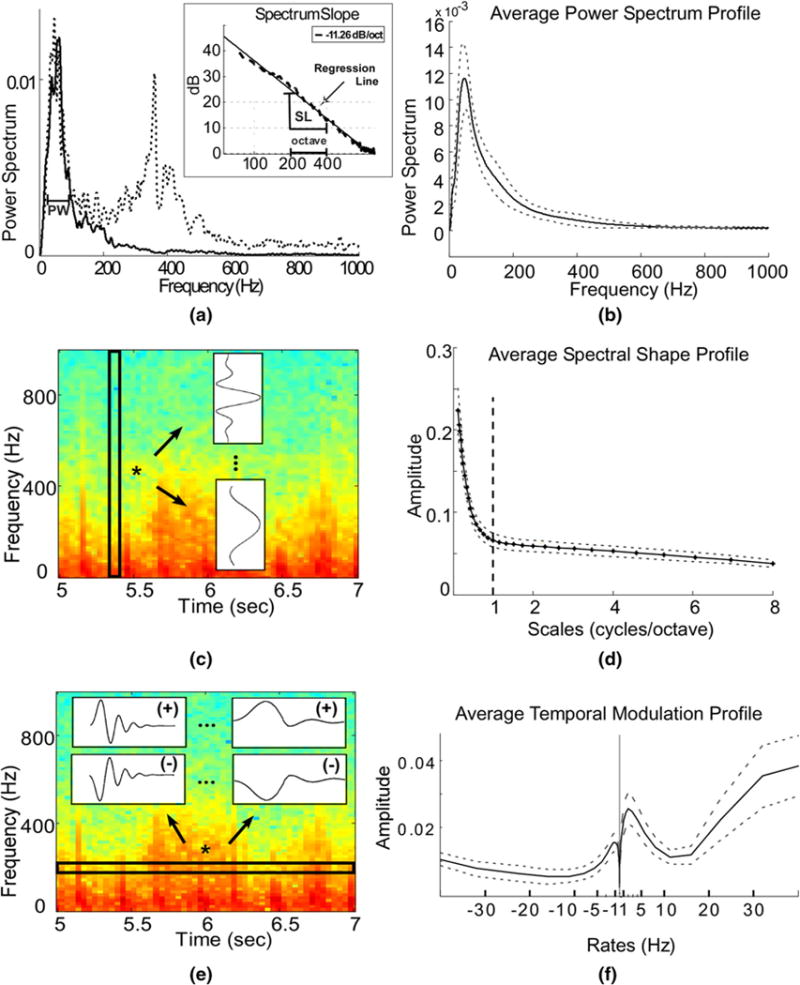
Methods: 186 healthy children with normal pulmonary exams and without respiratory complaints were enrolled at a tertiary care hospital in Lima, Peru. Lung sounds were recorded at eight thoracic sites using a digital stethoscope. 151 (81%) of the recordings were eligible for further analysis. Heavy-crying segments were automatically rejected and features extracted from spectral and temporal signal representations contributed to profiling of lung sounds.

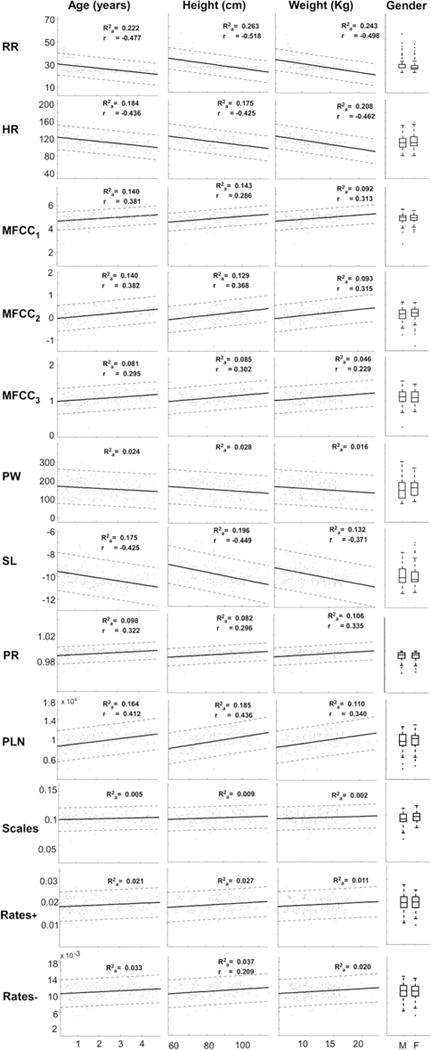
Results: Mean age, height, and weight among study participants were 2.2 years (SD 1.4), 84.7 cm (SD 13.2), and 12.0 kg (SD 3.6), respectively; and, 47% were boys. We identified ten distinct spectral and spectro-temporal signal parameters and most demonstrated linear relationships with age, height, and weight, while no differences with genders were noted. Older children had a faster decaying spectrum than younger ones. Features like spectral peak width, lower-frequency Mel-frequency cepstral coefficients, and spectro-temporal modulations also showed variations with recording site.

Conclusions: Lung sound extracted features varied significantly with child characteristics and lung site. A comparison with adult studies revealed differences in the extracted features for children. While sound-reduction techniques will improve analysis, we offer a novel, reproducible tool for sound analysis in real-world environments.


Conflict of interest statement

Conflict of interest

All authors in the study report no conflict of interest.

Figures

Fig. 1
Fig. 1
Recording excerpt of one study subject. Top the time waveform. Bottom the corresponding spectrogram representation, calculated on a 64 ms Hanning window with 50 % overlap. A processing window of 2-s duration is marked within the black margins. The two arrows indicate recorded noise, in the form of stethoscope movement (short burst of energy at 4.9 s) and cry (longer duration interval starting at 7.2 s). The color bar is shown in decibels (db)
Fig. 2
Fig. 2
a Power spectrum computed from the 2-s window marked in Fig. 1 bottom, and a power spectrum of an interval containing crying (dashed line). The peak width feature (PW) is marked. Inset shows the logarithmic spectrum (dashed line) and the corresponding regression line (solid line). The slope of the regression line (SL) is −11.26 dB/octave and is marked together with an octave interval. b The average subject profile of the power spectrum, as calculated using a short-time FFT, smoothed with a Butterworth low-pass filter. The dashed lines depict variations among different subjects. c Schematic representation for the extraction of the Spectral shape profile. Spectrogram information was processed for each time index and passed through a bank of 31 filters varying from narrowband (ex. top filter shown), capturing the peaky contents, to broadband (ex. bottom filter shown) capturing the smooth contents. For display purposes, spectrogram was computed on a 64 ms Hanning window with 50 % overlap. d The average profile for the spectral shape over all subjects. Dashed lines depict the variation among subjects, and the vertical bold line indicates the separation of contents below and above 1 cycle/octave. e Schematic representation for the extraction of the temporal modulation profile. Spectrogram information was processed along each frequency band and passed through a bank of 23 filters varying from high/fast rates (filters shown on the left) to low/slow rates (filters shown on the right), for both positive phase-downward direction (+) and negative phase-upward direction (−), capturing the changes of the frequency content along time. For display purposes spectrogram was computed on a 64 ms Hanning window with 50 % overlap. f The average profile for the temporal modulations over all subjects. Dashed lines depict the variation among subjects. Notice the strong energy around the region of −1 Hz and 2 Hz
Fig. 3
Fig. 3
Linear fit (solid line) for each feature (rows, y axis) with respect to patient characteristics (columns, x axis). Point-wise prediction bounds (see Online Supplement) with 95 % confidence level are also shown with dashed lines. Inset Ra2, the adjusted coefficient of determination of the quadratic fit; r, the linear correlation coefficient, displayed only if a significant correlation (P value <0.01) was achieved. Gender column: boxplots for boys (M) and girls (F). HR: heart rate, RR: respiratory rate, MFCC1,2,3: Mel-frequency cepstrum coefficients for filters centered at 56, 116, and 181 Hz, respectively, PW: spectrum peak width, SL: slope of regression line fit of the logarithmic spectrum, PR: power ratio of the total calculated power versus the power of the regression line, PLN: total power of the regression line

References

    1. Grenier MC, Gagnon K, Genest J, Jr, Durand J, Durand LG. Clinical comparison of acoustic and electronic stethoscopes and design of a new electronic stethoscope. Am J Cardiol. 1998;81:653–656. - PubMed
    1. Gurung A, Scrafford CG, Tielsch JM, Levine OS, Checkley W. Computerized lung sound analysis as diagnostic aid for the detection of abnormal lung sounds: a systematic review and meta-analysis. Respir Med. 2011;105:1396–1403. - PMC - PubMed
    1. Guntupalli KK, Alapat PM, Bandi VD, Kushnir I. Validation of automatic wheeze detection in patients with obstructed airways and in healthy subjects. J Asthma. 2008;45:903–907. - PubMed
    1. Murphy RL, Vyshedskiy A, Power-Charnitsky VA, Bana DS, Marinelli PM, Wong-Tse A, Paciej R. Automated lung sound analysis in patients with pneumonia. Respir Care. 2004;49:1490–1497. - PubMed
    1. Abaza AA, Day JB, Reynolds JS, Mahmoud AM, Goldsmith WT, McKinney WG, Petsonk EL, Frazer DG. Classification of voluntary cough sound and airflow patterns for detecting abnormal pulmonary function. Cough. 2009;5:8. - PMC - PubMed

Publication types