. 2014 Jun 19:5:4196.
doi: 10.1038/ncomms5196.

Disruption of astrocyte-vascular coupling and the blood-brain barrier by invading glioma cells

Affiliations

Disruption of astrocyte-vascular coupling and the blood-brain barrier by invading glioma cells

Stacey Watkins et al. Nat Commun. .

Abstract

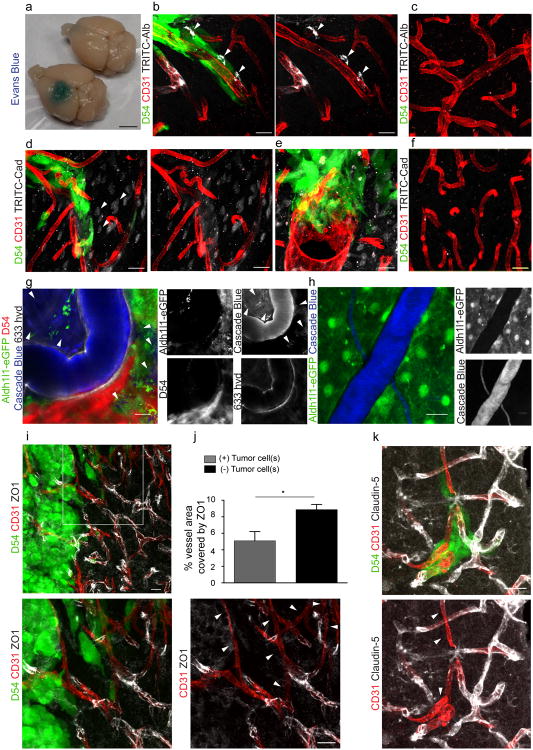
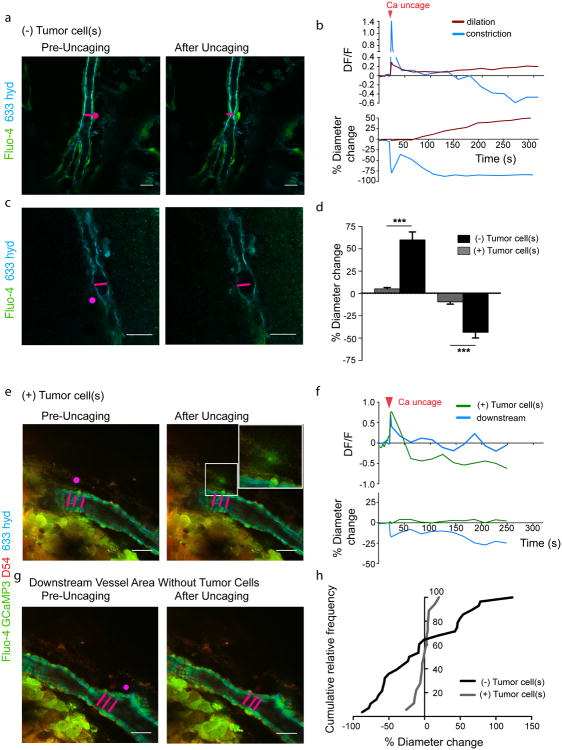
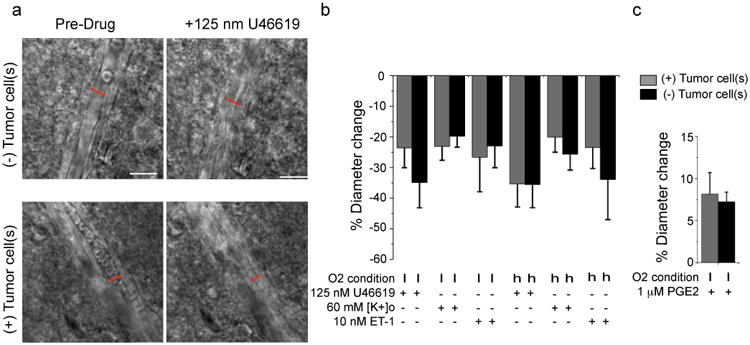
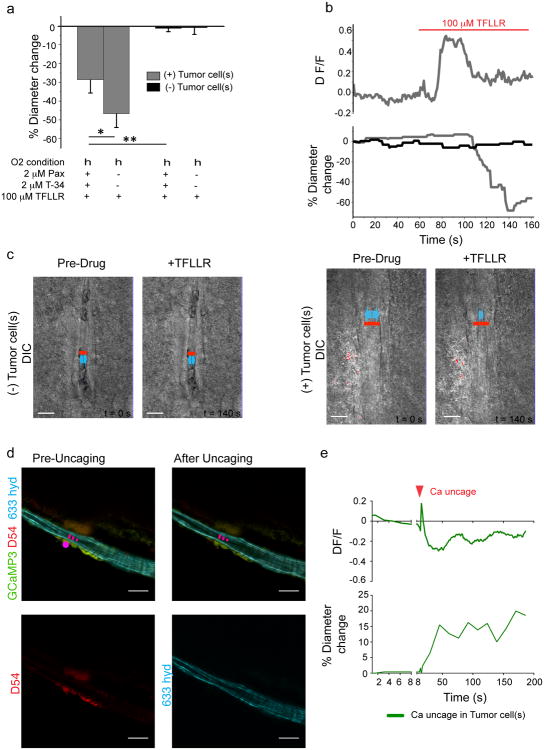
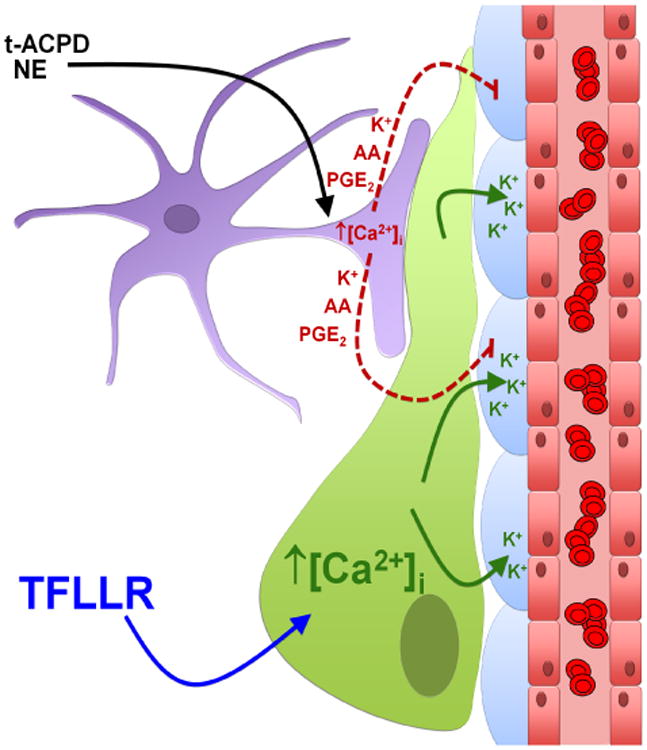
Astrocytic endfeet cover the entire cerebral vasculature and serve as exchange sites for ions, metabolites and energy substrates from the blood to the brain. They maintain endothelial tight junctions that form the blood-brain barrier (BBB) and release vasoactive molecules that regulate vascular tone. Malignant gliomas are highly invasive tumours that use the perivascular space for invasion and co-opt existing vessels as satellite tumour form. Here we use a clinically relevant mouse model of glioma and find that glioma cells, as they populate the perivascular space of preexisting vessels, displace astrocytic endfeet from endothelial or vascular smooth muscle cells. This causes a focal breach in the BBB. Furthermore, astrocyte-mediated gliovascular coupling is lost, and glioma cells seize control over the regulation of vascular tone through Ca(2+)-dependent release of K(+). These findings have important clinical implications regarding blood flow in the tumour-associated brain and the ability to locally deliver chemotherapeutic drugs in disease.


Conflict of interest statement

Conflicts of Interest: The authors declare no competing conflicts of interest.

Figures

Figure 1
Figure 1. Glioma cells can associate with blood vessels of all sizes and types
Immunofluorescence of CD31 (PECAM) and eGFP-expressing human glioma cells (D54) (a) or patient-derived xenograft lines GBM22 (b) and GBM14 (c) implanted in the cerebrum of immunodeficient mice highlighting the high number of invading glioma cells found along the vasculature. To be scored “vessel-associated” we required overlap of pixels of the endothelial cell (red) and the tumor cell (green) label in 1 to 2 um single planes of confocal images. Only a minority of cells is not found along the vasculature (d-f, arrow heads). Perivascular glioma cells can associate with capillaries (<7 μm) (g), penetrating arterioles or venules (7-35 μm) (h), and large arteries or veins (>35 μm) (i). Quantitative analysis based on 1634 cells in 5 random sections from each slice and 3 slices from 4 different animals (j). Immunofluorescence of Alexa Fluor 633 hydrazide dye (633 hyd, white) and eGFP-expressing astrocytes (Aldh1l1-eGFP) or human glioma cells (D54) implanted in the cerebrum of immunodeficient mice allowing to distinguish arterioles/arteries from venules/veins and capillaries (k-m). Black font was used to describe white labels in confocal images. Quantification of 75 sections from 4 tumor-bearing animals show that glioma cells associate with every type of vessel (j). In vivo visualization of eGFP-expressing human- glioma cells implanted in the cerebrum of immunodeficient mice found invading along the vasculature outlined by tetramethylrhodamine-dextran (TRITC-dex). Arterioles show divergent and venules show convergent blood flow at branch points (arrows in k,o,p). Perivascular glioma cells can associate with capillaries (n), penetrating arterioles (o), penetrating venules (p). Scale, 20 μm. Statistical data: a,d n=4 animals; b n=5 animals; c n=7 animals; f quantification for n=4 D54 animals, n=3 GBM22 and GBM14 animals; g-m n=9 animals; n-p n=34 animals.
Figure 2
Figure 2. Perivascular glioma cells can displace astrocytic endfeet along the vasculature
Immunofluorescence of CD31 (PECAM), aquaporin-4 (AQ4) and eGFP-expressing human glioma cells (D54) implanted in the cerebrum of immunodeficient mice show displacement of the astrocyte endfeet by tumor cells from the vessels in general (a) and from arterioles/arteries labeled with either alpha smooth muscle action (αSMA) (b) or Alexa Fluor 633 hydrazide (633 hyd) (c). This could be confirmed by implanting patient-derived xenograft tumors labeled with Human Nuclei (HuN) (d) or TdTomato-expressing human glioma cells (D54) (e) into the cerebrum of Aldh1l1-eGFP immunodeficient mice allowing visualization astrocyte endfeet independent of AQ4 expression. Perivascular glioma cells can intercalate between endothelial cells and astrocytic endfeet (a,c) or completely displace the astrocytic endfoot from the vascular surface (b). Electron microscopy (g-i) shows that perivascular astrocytes (brown) are less electron-dense than perivascular human glioma cells (green), which can displace astrocytic endfeet, allowing for physical contact with the endothelial cell (g-i) or can sometimes sit on top of astrocyte endfeet (i). Black font was used to describe white labels in confocal images. See panel f for quantification (n=34 vessels for D54; n=44 for GBM22; n=38 for GBM14). Scale, 20 μm (a-e); 2 μm (g), 4 μm (h,i). Statistical data: a-c n=18 animals; d n=12; e n=5 animals; g n=3 animals, h n=2 animals, i n=2 animals.
Figure 3
Figure 3. Perivascular glioma cell co-option causes a breakdown of the blood-brain barrier
The tracer, Evans blue, permeates into the brain parenchyma in tumor-bearing (n=3 animals) (bottom), but not in sham mice 3 weeks post surgery (n=3 animals) (top), Scale 5 mm. (a). Immunofluorescence of CD31 and intravenously injected tracers, tetramethylrhodamine-albumin (TRITC-alb, white) or -cadaverine (TRITC-cad, white), and implanted eGFP-expressing human glioma cells (D54) allow analysis of tracer leakage in relation to tumor burden. The large MW 70 kDa TRITC-albumin (b), as well as the small MW 950 Da TRITC-cadaverine (d) can be found outside the vasculature (arrows) (b-f, Suppl. Fig.6). Note that leaked TRITC-cadaverine is taken up by nearby neurons (arrows) (d,e). No extravasation was seen in the absence of tumor cells (c,f). To assess extravasation of the tracer Cascade blue (MW 10 kDa), Aldh1l1-eGFP-scid (eGFP) immunodeficient mice, which were previously implanted with TdTomato-expressing human glioma cells (D54), were retro-orbitally injected with Alexa Fluor 633 hydrazide dye (633 hyd) and Cascade blue (g,h). Accumulation of Cascade blue occurs in the brain's parenchyma indicating breakdown of the blood-brain barrier (BBB), where perivascular astrocytes have been displaced by glioma cell co-option (g). Vessels lacking tumor cells do not show extravasation of the dye (h). Immunohistochemistry for the TJ proteins zonula occludens-1 (ZO-1) (i) and claudin-5 (k) show that these protein are lost from endothelial cells labeled with CD31 where tumor cells are present (enlarged panel, arrows), but colocalize with endothelial cells in tissue that has not been co-opted. Quantification of ZO-1 shows reduction of vessel coverage in areas co-opted by glioma cells. 8.86 ± 0.64% vessel area is covered by ZO-1 in control images, whereas this number was reduced to 5.1 ± 1.11% in areas where vessels were coopted by tumor cells (n=9 images each for control and tumor-covered vessels from 3 animals, paired t-test directly comparing control and tumor images in the same slice, p=0.037, error bars refer to SEM) (j). Black font was used to describe white labels in confocal images. Scale 20 μm. Statistical data: b,c n=10 animals; d-f n=7 animals; g n=2 animals; h n=4 animals; i,k n=6 animals.
Figure 4
Figure 4. Loss of astrocyte-vascular coupling following vessel co-option by gliomas
(a) DIC images of vessels without (top) or with (bottom) perivascular glioma cells before and after application of 100 μM trans-ACPD (t-ACPD). Perivascular glioma cell presence was verified by eGFP-fluorescence. (b) Changes in vessel diameter for an arteriole associated (grey) and not associated (black) with perivascular glioma cells over the course of one experiment when exposed to 100 μM trans-ACPD (arrowhead). (c) Average change in vessel diameters observed at high (h) (95%) and low (l) (20%) oxygen for vessels associated (grey) and not associated (black) with glioma cells when exposed to 100 μM trans-ACPD. (d) DIC images of vessels without (top) or with (bottom) perivascular glioma cells before and after application of 10 μM norepinephrine (NE). Perivascular glioma cell presence was verified by eGFP-fluorescence. (e) Changes in vessel diameter for an arteriole associated (grey) and not associated (black) with perivascular glioma cells over the course of one experiment when exposed to 10 μM NE (arrowhead). (f) Average change in vessel diameters observed at high (h) (95%) and low (l) (20%) oxygen for vessels associated (grey) and not associated (black) with glioma cells when exposed to 10 μM NE. For experiments performed at low oxygen concentrations, arterioles were preconstricted with 125 nM U46619 for 20 min. Statistical data provided in results section, error bars refer to SEM. Scale, 20 μm.
Figure 5
Figure 5. Vascular responses to Ca2+ uncaging in astrocytes is impaired in vessels co-opted by glioma cells
[Ca2+]i uncaging in an astrocyte endfoot or cell body close to an arteriole free of glioma cells leads to either constriction (a) or dilation (c) of the vessel. The vessel response is preceded by a rise in [Ca2+]i (b,d). The pink spot indicates the location of Ca2+ uncaging. Measurement of the Ca2+ response was performed in this region or in an immediate adjacent region. Vessels encased by glioma cells do not respond to Ca2+ uncaging in nearby astrocytes (e,f). Stimulation of astrocytes in tumor-free areas of the same vessel (downstream vessel area) causes constriction showing that the lack of response is specific for areas covered by glioma cells (f,g). The cumulative relative frequency distribution shows a wide range of dilatory or constricting vessel responses in controls, whereas most vessels associated with glioma do not respond or do so to a lesser extent (h). Statistical data in d: control dilating vessels, 60.05 ± 8.899 %, n=10 vessels, tumor dilating, 5.18 ± 1.493, n=8, two-tailed unpaired t-test, p ≤ 0.0001; control constricting vessels, -43.51 ± 6.283 % n=18 vessels, glioma constricting, -9.389 ± 2.611 %, n=9. two-tailed unpaired t-test, p≤ 0.001, error bars refer to SEM. Scale, 20 μm.
Figure 6
Figure 6. Perivascular glioma cells do not compromise vascular smooth muscle cell function
DIC images of vessels without (top) or with (bottom) perivascular glioma cells before and after application of 125 nM U46619. Perivascular glioma cell presence was verified by eGFP-fluorescence (a). Average change in vessel diameters observed at high (h) (95%) and low (l) (20%) oxygen for vessels associated (grey) and not associated (black) with glioma cells when exposed to 125 nM U46619, 60 mM [K+]o, 10 nM ET-1 (b) and 1 μM PGE2 (c). For 1 μM PGE2, arterioles were preconstricted with 125 nM U46619 for 20 min. Statistical data as follows: 20% Oxygen. 125 nM U46619: (+)Tumor Cell(s) n=11, (-)Tumor Cell(s) n=11, two-tailed Mann Whitney Test, p=0.40; 60 mM [K+]o: (+)Tumor Cell(s) n=10, (-)Tumor Cell(s) n=9, two-tailed unpaired t-test, p=0.57; 10 nM ET-1: (+)Tumor Cell(s) n=8, (-)Tumor Cell(s) n=9, two-tailed unpaired t-test, p=0.78; 1 μM PGE2: (+)Tumor Cell(s) n=14, (-)Tumor Cell(s) n=21, two-tailed unpaired t-test, p=0.72. 95% Oxygen. 125 nM U46619: (+)Tumor Cell(s) n=14. (-)Tumor Cell(s) n=12, two-tailed unpaired t-test, p=0.99; 60 mM [K+]o: (+)Tumor Cell(s) n=11, (-)Tumor Cell(s) n=19, two-tailed Mann-Whitney Test, p>0.9999; 10 nM ET-1: (+)Tumor Cell(s) n=7, (-)Tumor Cell(s) n=9, two-tailed unpaired t-test, p=0.48). Error bars refer to SEM Scale, 20 μm.
Figure 7
Figure 7. Perivascular glioma cells can hijack control over vasculature tone similar to astrocytes
Average change in vessel diameters observed in high (h) (95%) oxygen for vessels associated (grey) and not associated (black) with glioma cells when exposed to 100 μM TFLLR or 100 μM TFLLR + 2 μM paxilline (Pax) + 2 μM Tram-34 (a). Changes in vessel diameter for an arteriole associated (grey) and not associated (black) with perivascular glioma cells over the course of one experiment when exposed to 100 μM TFLLR. Changes in Ca2+ (ΔF/F) in perivascular GCamp3-GFP-expressing glioma cells were simultaneously measured over the course of this experiment (b). DIC images of vessel associated with glioma cells ((-)Tumor Cells) before and after sufficient exposure to 100 μM TFLLR (left), ((+)Tumor Cells) before and at most constricted time point after application of 100 μM TFLLR (right), red lines indicate position of diameter measurement and vessel diameter before drug application, blue arrows indicate vessel diameter, Scale, 10 μm (c). Statistical data provided in results section, error bars refer to SEM. Acute slices from mice bearing GCamp3-GFP-expressing D54 gliomas that also expressed the red fluorescent protein tdTomato were loaded with DMNPE-4 caged Ca2+. [Ca2+]i uncaging in TdTomato-positive glioma cells located at arterioles resulted in vascular responses (n=3), this example shows a dilation (d) Scale, 20 μm. Traces showing a fast [Ca2+]I increase preceding the vascular response and slower oscillations at later time points. Data were corrected for dye bleaching using the bleach correction macro for ImageJ. (e).
Figure 8
Figure 8. Perivascular glioma cells disrupt astrocyte-mediated vascular coupling
The perivascular glioma cell (green) inserts itself between the vascular smooth muscle cells (VSMCs) (blue) surrounding the vascular endothelial cells (red), displacing the astrocytic endfoot (purple). Bath application of norepinephrine (NE) and trans-ACPD (t-ACPD) activates astrocytic G-protein coupled receptors causing an increase in astrocytic [Ca2+]i. Due to perivascular glioma cell displacement of the astrocytic endfoot, astrocyte-released vasoactive molecules (arachidonic acid (AA), prostaglandin E2 (PGE2), and K+) can no longer reach the VSMCs to cause alterations in vessel diameter. Glioma cell-protease activated receptor 1 (PAR1) activation by the artificial ligand, TFLLR, causes increases in glioma cell [Ca2+]i, which activates Ca2+-activated K+ channels. Glioma efflux of K+ onto VSMCs causes vasoconstriction of arterioles.

References

    1. Kimelberg HK, Nedergaard M. Functions of astrocytes and their potential as therapeutic targets. Neurotherapeutics : the journal of the American Society for Experimental NeuroTherapeutics. 2010;7:338–353. - PMC - PubMed
    1. Mathiisen TM, Lehre KP, Danbolt NC, Ottersen OP. The perivascular astroglial sheath provides a complete covering of the brain microvessels: an electron microscopic 3D reconstruction. Glia. 2010;58:1094–1103. - PubMed
    1. Winkler EA, Bell RD, Zlokovic BV. Central nervous system pericytes in health and disease. Nat Neurosci. 2011;14:1398–1405. - PMC - PubMed
    1. Abbott NJ, Patabendige AA, Dolman DE, Yusof SR, Begley DJ. Structure and function of the blood-brain barrier. Neurobiol Dis. 2010;37:13–25. - PubMed
    1. Abbott NJ, Ronnback L, Hansson E. Astrocyte-endothelial interactions at the blood-brain barrier. Nat Rev Neurosci. 2006;7:41–53. - PubMed

Publication types