Clinical Trial
. 2015 May;41(5):1374-82.
doi: 10.1002/jmri.24663. Epub 2014 Jun 19.

Prediction of chemotherapeutic response in bladder cancer using K-means clustering of dynamic contrast-enhanced (DCE)-MRI pharmacokinetic parameters

Affiliations
Clinical Trial

Prediction of chemotherapeutic response in bladder cancer using K-means clustering of dynamic contrast-enhanced (DCE)-MRI pharmacokinetic parameters

Huyen T Nguyen et al. J Magn Reson Imaging. 2015 May.

Abstract

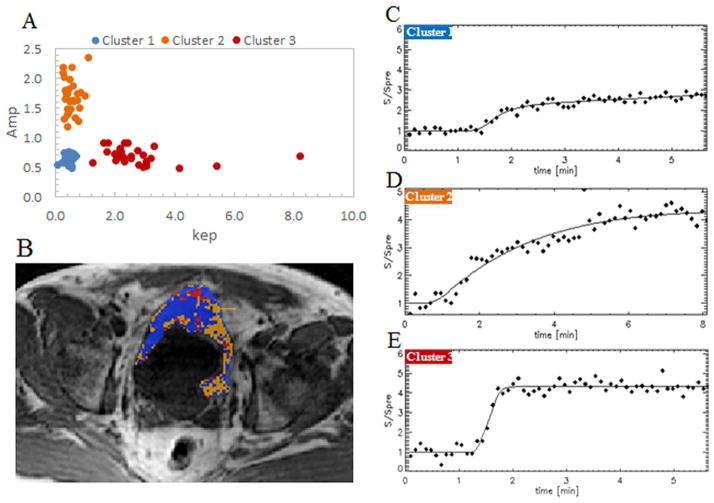
Purpose: To apply k-means clustering of two pharmacokinetic parameters derived from 3T dynamic contrast-enhanced magnetic resonance imaging (DCE-MRI) to predict the chemotherapeutic response in bladder cancer at the mid-cycle timepoint.

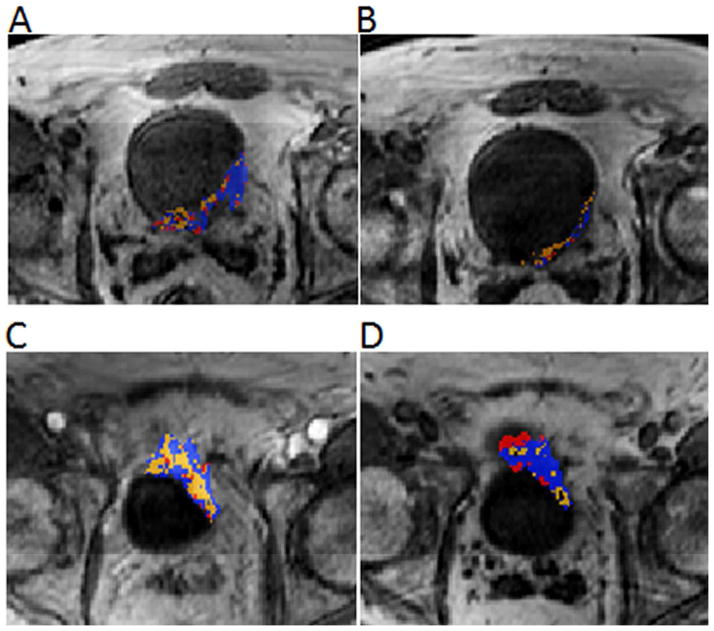
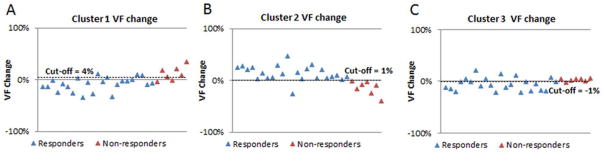
Materials and methods: With the predetermined number of three clusters, k-means clustering was performed on nondimensionalized Amp and kep estimates of each bladder tumor. Three cluster volume fractions (VFs) were calculated for each tumor at baseline and mid-cycle. The changes of three cluster VFs from baseline to mid-cycle were correlated with the tumor's chemotherapeutic response. Receiver-operating-characteristics curve analysis was used to evaluate the performance of each cluster VF change as a biomarker of chemotherapeutic response in bladder cancer.

Results: The k-means clustering partitioned each bladder tumor into cluster 1 (low kep and low Amp), cluster 2 (low kep and high Amp), cluster 3 (high kep and low Amp). The changes of all three cluster VFs were found to be associated with bladder tumor response to chemotherapy. The VF change of cluster 2 presented with the highest area-under-the-curve value (0.96) and the highest sensitivity/specificity/accuracy (96%/100%/97%) with a selected cutoff value.

Conclusion: The k-means clustering of the two DCE-MRI pharmacokinetic parameters can characterize the complex microcirculatory changes within a bladder tumor to enable early prediction of the tumor's chemotherapeutic response.

Keywords: bladder cancer; chemotherapeutic response; k-means clustering; pharmacokinetic parameters.


Figures

Figure 1
Figure 1. Flow charts of response criteria (A) and data analysis (B)
Flow chart A: Response criteria. TURBT, transurethral resection of bladder tumor. In blue is the flow of the comparison between the pathological classifications of TURBT (Pre-chemotherapy stage) and cystectomy (post-chemotherapy) specimens. In red is the flow of the comparison between pre- and post- chemotherapy tumor volumes estimated by a radiologist on T2W MR images. The response criteria were based on the changes of both pT classification (T stage) and tumor volume. Flow chart B: Data analysis using k-means clustering. Amp, the amplitude of signal enhancement. kep, the exchange rate of the contrast agent between EES and the plasma space. VF, volume fraction. In blue is the flow of baseline data. In light red is the flow of mid-cycle data. The k-means clustering of (Ampn, kepn) space was performed on each patient data pool that includes the patient’s baseline and mid-cycle data to determine three cluster centers (centroids). With the determined centroids, three cluster VFs of the patient’s tumor at baseline and mid-cycle were separately calculated. The differences of three cluster VFs were correlated with the tumor response.
Figure 2
Figure 2. Signal enhancement characteristics of the three clusters
Image A: The distribution of three cluster centers in the (Amp and kep) space. For each of thirty patients, a set of three cluster centers were determined. Cluster centers of all thirty patients were distributed in the same region. Image B: A color cluster map. MR image of a male patient, aged 59. In blue, orange, and red are the voxels of cluster 1, cluster 2, and cluster 3, respectively. Images C, D, E: The signal intensity curves of three clusters. Cluster 1 (blue) with low kep and low Amp has a flat and shallow curve. Cluster 2 (orange) with low kep and high Amp has a high curve. Cluster 3 (red) with high kep and low Amp has a steep-sloped curve.
Figure 3
Figure 3. Color cluster maps of a responder (A, B) vs. a non-responder (C, D). MR images of a responder (male, age: 51) and a non-responder (male, age: 54)
Images A, B: In a responsive tumor, cluster 1 (blue) and cluster 3 (red) show a larger volume reduction than cluster 2 (orange) from baseline (Image A) to mid-cycle (Image B). This results in the reduction of the VFs of clusters 1 and 3, and the increase of the cluster 2 VF. Images C, D: In a non-responsive tumor, cluster 1 (blue) and cluster 3 (red) show a volume increase, while cluster 2 (orange) shows a volume reduction from baseline (Image C) to mid-cycle (Image D). This results in the increase of the VFs of clusters 1 and 3, and the reduction of the cluster 2 VF.
Figure 4
Figure 4. Cluster plots of a responder (A, B) vs. a non-responder (C, D) in the (Amp and kep) space
Plots A and B: Cluster plots for a responsive tumor. From baseline (Plot A) to mid-cycle (Plot B), the VFs of clusters 1, 2, 3 change from 69% to 60% (decrease), from 7% to 37% (increase), from 24% to 3% (decrease), respectively. Plots C and D: Cluster plots for a non-responsive tumor. From baseline (Plot C) to mid-cycle (Plot D), the VFs of clusters 1, 2, 3 change from 35% to 56% (increase), from 43% to 18% (decrease), from 22 to 26% (increase), respectively.
Figure 5
Figure 5
ROC curve analysis of the three VF changes for predicting chemotherapeutic response in bladder cancer at the mid-cycle time-point. Plot A: ROC curve for cluster 1. Plot B: ROC curve for cluster 2. Plot C: ROC curve for cluster 3. Plot D: Three ROC curves in comparison. The cutoff values of VF changes for clusters 1, 2, and 3 were selected with the points marked with 0.69, 0.78, and 0.76 on ROC curves, respectively.
Figure 6
Figure 6
The volume fraction (VF) changes of three clusters from baseline to mid-cycle in responders vs. non-responders. Graphs A, B, C are respectively the VF changes of clusters 1, 2, 3 in twenty-three responders (blue triangles) and seven non-responders (red triangles) with a selected cutoff value (represented by dot lines).

References

    1. Griffiths TR. Current perspectives in bladder cancer management. Int J Clin Pract. 2013;67:435–448. - PubMed
    1. Griffiths G, Hall R, Sylvester R, Raghavan D, Parmar MK. International phase III trial assessing neoadjuvant cisplatin, methotrexate, and vinblastine chemotherapy for muscle-invasive bladder cancer: long-term results of the BA06 30894 trial. J Clin Oncol. 2011;29:2171–2177. - PMC - PubMed
    1. Chang JS, Lara PN, Jr, Pan CX. Progress in personalizing chemotherapy for bladder cancer. Adv Urol. 2012;2012:364919. - PMC - PubMed
    1. Barentsz JO, Berger-Hartog O, Witjes JA, et al. Evaluation of chemotherapy in advanced urinary bladder cancer with fast dynamic contrast-enhanced MR imaging. Radiology. 1998;207:791–797. - PubMed
    1. Dobson MJ, Carrington BM, Collins CD, et al. The assessment of irradiated bladder carcinoma using dynamic contrast-enhanced MR imaging. Clin Radiol. 2001;56:94–98. - PubMed

Publication types

MeSH terms