Review
. 2014 Jul;4(3):1201-28.
doi: 10.1002/cphy.c130040.

Classical Renin-Angiotensin system in kidney physiology

Affiliations
Review

Classical Renin-Angiotensin system in kidney physiology

Matthew A Sparks et al. Compr Physiol. 2014 Jul.

Abstract

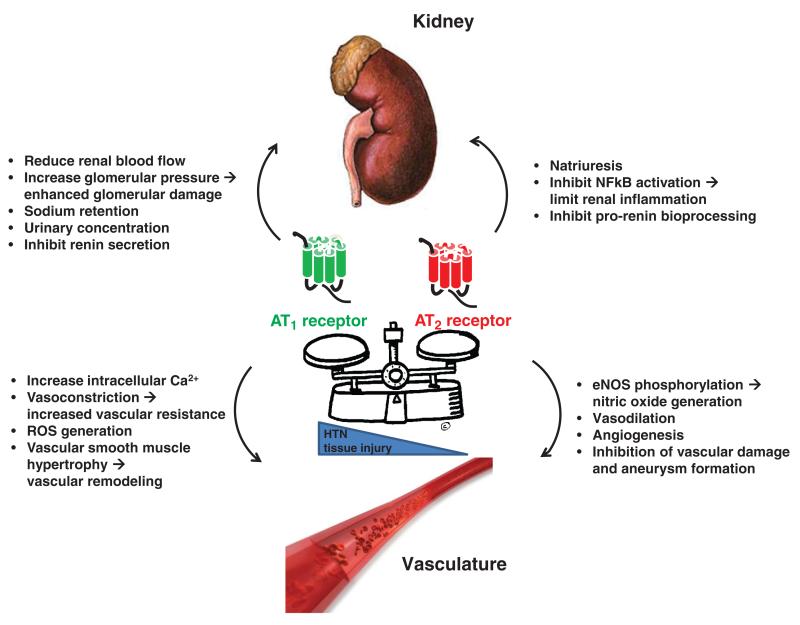
The renin-angiotensin system has powerful effects in control of the blood pressure and sodium homeostasis. These actions are coordinated through integrated actions in the kidney, cardiovascular system and the central nervous system. Along with its impact on blood pressure, the renin-angiotensin system also influences a range of processes from inflammation and immune responses to longevity. Here, we review the actions of the "classical" renin-angiotensin system, whereby the substrate protein angiotensinogen is processed in a two-step reaction by renin and angiotensin converting enzyme, resulting in the sequential generation of angiotensin I and angiotensin II, the major biologically active renin-angiotensin system peptide, which exerts its actions via type 1 and type 2 angiotensin receptors. In recent years, several new enzymes, peptides, and receptors related to the renin-angiotensin system have been identified, manifesting a complexity that was previously unappreciated. While the functions of these alternative pathways will be reviewed elsewhere in this journal, our focus here is on the physiological role of components of the "classical" renin-angiotensin system, with an emphasis on new developments and modern concepts.


Figures

Figure 1
Figure 1
Classical renin-angiotensin system (RAS). Through sequential cleavage of protein substrates by specific proteases, the multi-functional peptide hormone angiotensin II is generated by the “classical” RAS. The primary substrate for the RAS is angiotensinogen. While the liver is the primary source of angiotensinogen, it is also produced in other tissues including the kidney. Renin is an aspartyl-protease that catalyzes cleavage of the 10-amino acid peptide angiotensin I from the N-terminus of the angiotensinogen molecule. In a sequential reaction, the dicarboxyl-peptidase angiotensin converting enzyme (ACE) removes 2 amino acids from the C-terminus of angiotensin I to form angiotensin II. The biological actions of the “classical” RAS are executed through high affinity binding of angiotensin II to specific angiotensin receptors. These receptors belong to the large family of G-protein coupled receptors (GPCRs) and can be separated into two pharmacological classes, AT1 and AT2, each with distinct functions linked to specific intra-cellular signaling pathways.
Figure 2
Figure 2
Angiotensinogen and its complex with renin (used with permission from Zhou et al. Nature 468: 108-111, 2010). (A) Stereo image of human angiotensinogen. Serpin template in grey and helix A in purple with the A-sheet in brown, the unresolved reactive loop in red, and in dark purple the CD loop containing Cys 138. The amino-tail is in blue with the new helix A1 and a second helix A2 containing Cys18 (linked in brown to Cys 138); the terminal angiotensin I segment is in green with the renin-cleavage site shown as green and blue balls. The sequence below (same color coding) also indicates the subsequent cleavage by angiotensin converting enzyme (ACE) releasing the octapeptide angiotensin II. (B) the initiating complex formed by angiotensinogen with inactivated (Asp292Ala) renin (left), and on right superimposed on the unreacted form (brown) showing the displacement of the CD loop and the movement of the aminoterminal peptide (visible to Cys 18), into the active cleft of renin.
Figure 3
Figure 3
Renin expression (used with permission from Gomez et al. Kidney Int., 2009, 460-462). During embryonic development, renin-expressing cells (depicted above as yellow with black dots) can be found along the intrarenal arteries, the glomeruli and the interstitium. This pattern is progressively restricted and in the adult kidney renin can be only found in a few cells in the juxtaglomerular (JG) area. However, in response to various physiological stimuli such as severe sodium depletion, renal cells can reacquire renin expression (recruitment). In these cases, renin expression can be observed mainly in cells along the afferent arteriole as well as in the interstitium, the mesangium, glomerular capsule, and efferent arteriole.
Figure 4
Figure 4
Overview of the major signaling pathways involved in regulation of renin. Figure is reproduced, with permission, from Schnermann and Briggs, 2012; Kidney Int 81, 529-538. Details about the effects of each pathway (stimulatory or inhibitory) are described in the text. A1AR, A1 adenosine receptor subtype; cAMP, cyclic adenosine monophosphate; cGMP, cyclic guanosine monophosphate; eNOS, endothelial nitric oxide synthase; nNOS, neuronal nitric oxide synthase; NO, nitric acid; PACAP, pituitary adenylate cyclase-activating polypeptide; PDE3, phosphodiesterase 3; PGE2, prostaglandin E2.
Figure 5
Figure 5
Renin mRNA in kidney cortex and kidney medulla from Gsα-deficient mice. (Used with permission from Chen et al. Am J Physiol Renal Physiol 2007, F27-F37) RC/FF mice (n 6) relative to control animals (n 12; 9 RR/GG and 6 RR/FF) as determined by quantitative are given for comparisons between genotypes. PCR. Significances are given for comparisons between genotypes.
Figure 6
Figure 6
Attenuation of the antihypertensive efficacy of ACE inhibitors with the B2 bradykinin receptor antagonist icatibant. (Used with permission from Gainer et al. N Engl J Med 339: 1285-1292, 1998.) Mean arterial pressures (MAP) were measured over 250 min in hypertensive patients treated with placebo, ACE inhibitor alone, ACE inhibitor + icatibant, and angiotensin receptor blocker (ARB). The largest blood pressure reduction was seen with ACE inhibitor alone, and this was attenuated when icatibant was given along with the ACE inhibitor. The extent of blood pressure lowering was intermediate and equivalent in the groups receiving the ARB or ACE inhibitor + icatibant.
Figure 7
Figure 7
Kidney cross-transplantation groups. Wild-type (+/+) or AT1A (−/−) receptor-deficient mice were transplanted with kidneys from wild-type or AT1A−/− mice. Group I animals (Wild-type) had a full complement of AT1A receptors. Group II animals (Kidney KOs) expressed AT1A receptors only outside the kidney. Group III animals (Systemic KOs) expressed AT1A receptors only within the kidney. Group IV animals (Total KOs) completely lacked AT1A receptors.
Figure 8
Figure 8
Blood pressures and urinary sodium excretion during chronic Ang II infusion in mice after kidney cross-transplantation. (A) Daily, 24-h blood pressures in the experimental groups before (“pre”) and during 21 days of Ang II infusion (*, P ≤ 0.03 vs. Wild-type; §, P < 0.008 vs. Systemic KO; †, P < 0.006–0.0001 vs. Wild-type). (B) Cumulative sodium excretion during the first 5 days of Ang II infusion. (§, P < 0.02 vs. Kidney KO and P = 0.03 vs. Total KO; ‡, P = 0.03 vs. Kidney KO and Total KO). (C) Change in body weights after 5 days of Ang II infusion. (*, P = 0.03 vs. “pre”; #, P = 0.05 vs. “pre”).
Figure 9
Figure 9
AT1A receptors in the proximal tubule promote hypertension (A) With infusion of ang II (1000 ng/kg/min), BPs increased significantly in both control and PTKO mice but the hypertensive response to angiotensin II was significantly attenuated in the PTKOs (**; P < 0.001). (B) The mean increase in BP during the angiotensin II infusion was significantly less in the PTKOs (23 ± 3 mmHg) compared to controls (black bars; 38 ± 5 mmHg, *; P 0.0005). (C) Cumulative sodium balance was significantly lower in the PTKOs (n = 8) than controls (n = 7, *; P = 0.046) during the first 3 days of Ang II infusion. Error bars represent SEM.
Figure 10
Figure 10
The myriad actions of angiotensin receptors in the kidney and vasculature. In cardiovascular control centers, the effects of AT2 receptor stimulation oppose and ameliorate the prohypertensive and proinflammatory effects of AT1 receptor stimulation.

References

    1. Ahn D, Ge Y, Stricklett PK, Gill P, Taylor D, Hughes AK, Yanagisawa M, Miller L, Nelson RD, Kohan DE. Collecting duct-specific knockout of endothelin-1 causes hypertension and sodium retention. J Clin Invest. 2004;114:504–511. - PMC - PubMed
    1. Aldehni F, Tang T, Madsen K, Plattner M, Schreiber A, Friis UG, Hammond HK, Han PL, Schweda F. Stimulation of renin secretion by catecholamines is dependent on adenylyl cyclases 5 and 6. Hypertension. 2011;57:460–468. - PMC - PubMed
    1. Allen AM, Dosanjh JK, Erac M, Dassanayake S, Hannan RD, Thomas WG. Expression of constitutively active angiotensin receptors in the rostral ventrolateral medulla increases blood pressure. Hypertension. 2006;47:1054–1061. - PubMed
    1. Amlal H, LeGoff C, Vernimmen C, Soleimani M, Paillard M, Bichara M. ANG II controls Na(+)-K (NH4)-2Cl-cotransport via 20-HETE and PKC in medullary thick ascending + +limb. Am J Physiol. 1998;274:C1047–C1056. - PubMed
    1. Andresen BT, Romero GG, Jackson EK. AT2 receptors attenuate AT1 receptor-induced phospholipase D activation in vascular smooth muscle cells. J Pharmacol Exp Ther. 2004;309:425–431. - PubMed