. 2014 Jun 18;6(241):241ra77.
doi: 10.1126/scitranslmed.3007803.

Circulating cell-free DNA enables noninvasive diagnosis of heart transplant rejection

Affiliations

Circulating cell-free DNA enables noninvasive diagnosis of heart transplant rejection

Iwijn De Vlaminck et al. Sci Transl Med. .

Abstract

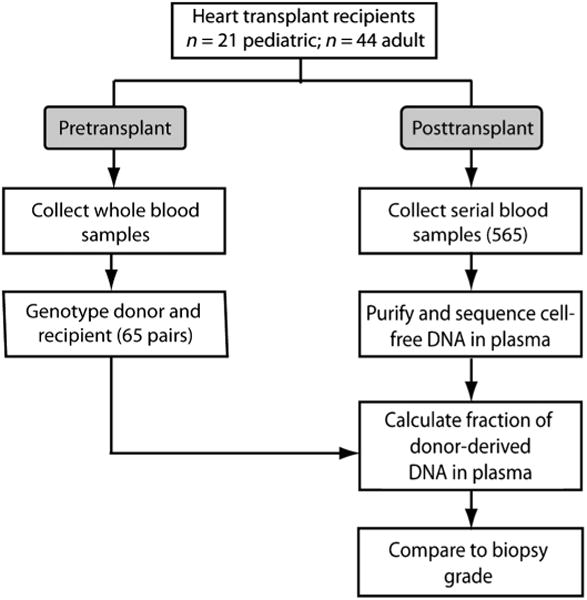
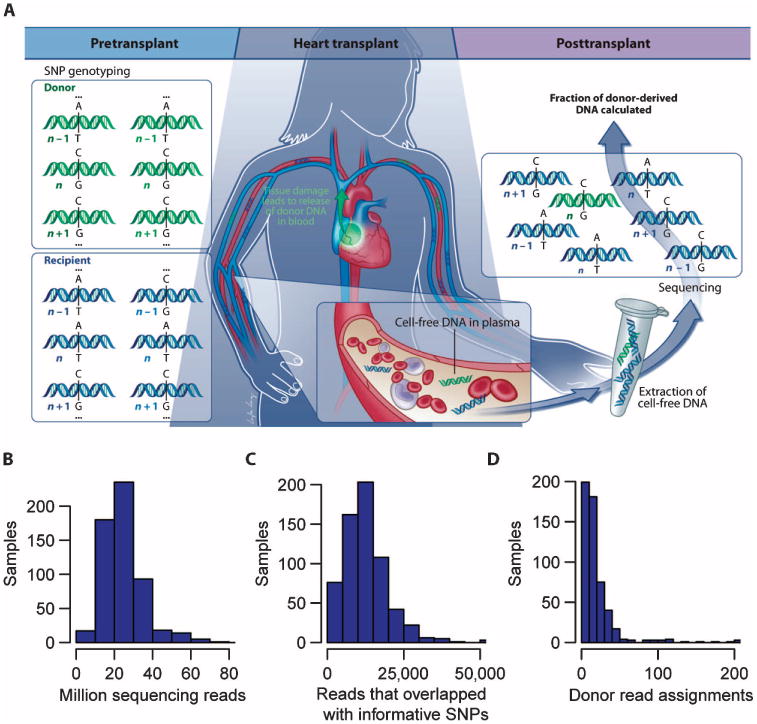
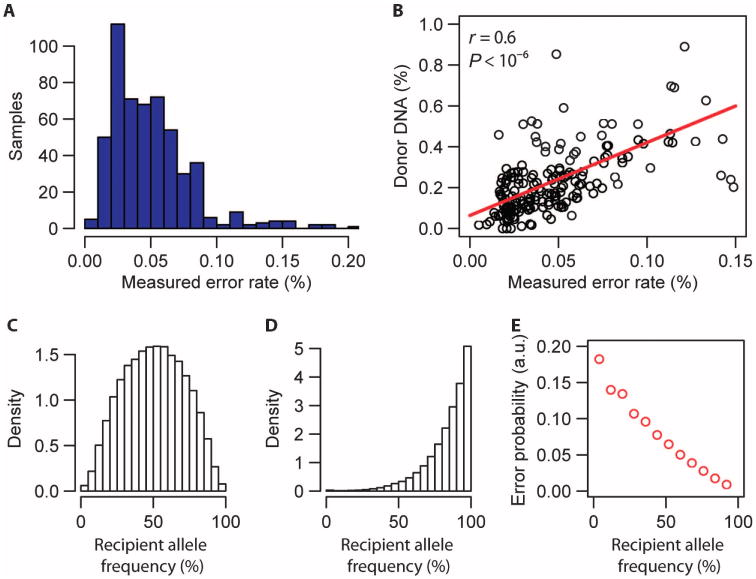
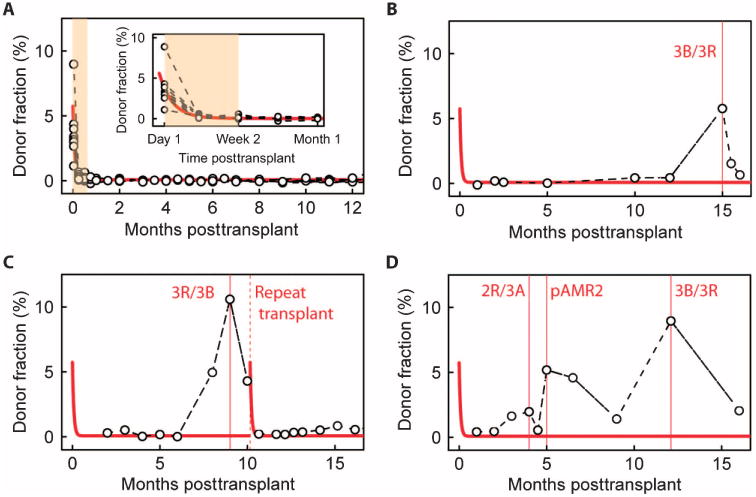
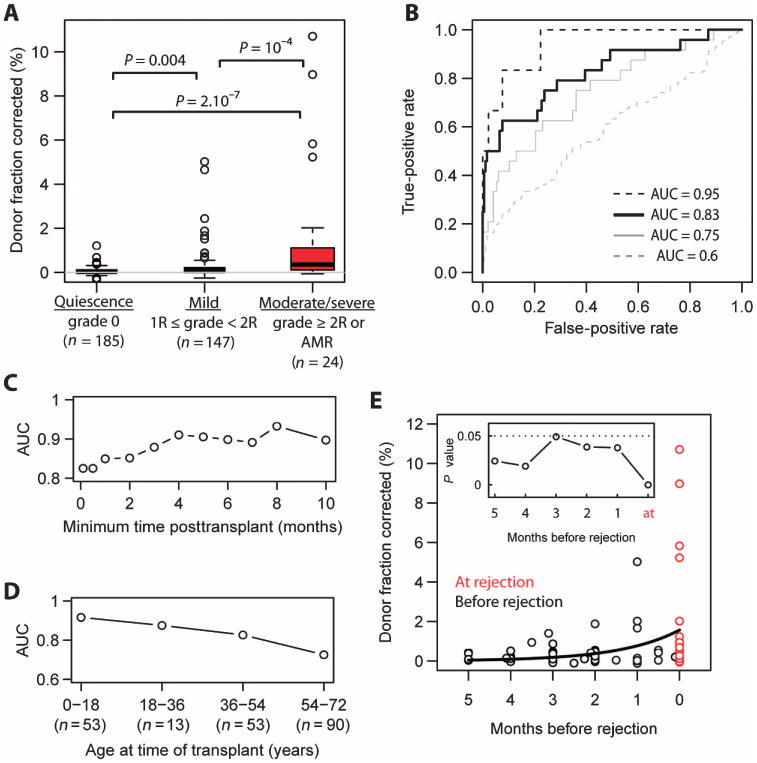
Monitoring allograft health is an important component of posttransplant therapy. Endomyocardial biopsy is the current gold standard for cardiac allograft monitoring but is an expensive and invasive procedure. Proof of principle of a universal, noninvasive diagnostic method based on high-throughput screening of circulating cell-free donor-derived DNA (cfdDNA) was recently demonstrated in a small retrospective cohort. We present the results of a prospective cohort study (65 patients, 565 samples) that tested the utility of cfdDNA in measuring acute rejection after heart transplantation. Circulating cell-free DNA was purified from plasma and sequenced (mean depth, 1.2 giga-base pairs) to quantify the fraction of cfdDNA. Through a comparison with endomyocardial biopsy results, we demonstrate that cfdDNA enables diagnosis of acute rejection after heart transplantation, with an area under the receiver operating characteristic curve of 0.83 and sensitivity and specificity that are comparable to the intrinsic performance of the biopsy itself. This noninvasive genome transplant dynamics approach is a powerful and informative method for routine monitoring of allograft health without incurring the risk, discomfort, and expense of an invasive biopsy.


Conflict of interest statement

Competing interests: Stanford University has applied for a patent relating to the method described in this study. S.R.Q. is a founder of and consultant for ImmuMetrix, LLC, which has licensed a patent from Stanford regarding this technology and is developing this technology for the clinic. S.R.Q. and T.M.S. hold equity in ImmuMetrix Inc.

Figures

Fig. 1
Fig. 1. Enrollment of patients, collection of clinical samples, and analysis workflow
Sixty-five heart transplant recipients were enrolled in the study (table S1). Donor and recipient pretransplant whole-blood samples were collected and processed for genotyping. Plasma samples were collected longitudinally after transplant, and circulating cell-free DNA was purified and sequenced. The fraction of cfdDNA was estimated and compared against biopsy scores (n = 356).
Fig. 2
Fig. 2. Principle of the assay and assignment and read statistics
(A) Working principle of the assay. The donor and recipient were SNP-genotyped before the transplant procedure. Shotgun sequencing of circulating cell-free DNA is performed to count the number of donor- and recipient-derived DNA molecules. SNP positions with single-base alleles that were distinct between the donor and recipient and homozygous within each individual allowed discrimination of donor- and recipient-derived sequences (position “n” in the cartoon, but not positions “n − 1” and “n + 1”). (B) Histogram of sequencing depth (24.7 ± 11 million reads, mean ± SD). (C) Histogram of number of reads that overlap with informative SNP positions. (D) Histogram of the number of donor sequence assignments, ND. Data in (B) to (D) are from 565 patient samples.
Fig. 3
Fig. 3. Rate of incorrect donor or recipient sequence assignments
(A) Histogram of the measured per-sample error rate (error rates <0.2%, n = 540). (B) Linear correlation between the measured donor DNA fraction for patients at quiescence (biopsy score 0, n = 185) and measured error rate (Spearman correlation coefficient, r). The red line is a linear fit, slope (a) = 3.6 ± 0.36 (linear regression, t value slope = 9.4). (C) Histogram of the recipient allele frequency (frequency of occurrence in the human population) for SNP markers that were used to discriminate donor- and recipient-derived sequences and to measure the cfdDNA fraction (n = 7 patients, all markers). Here, SNPs were selected for which both the donor and recipient were homozygous and carried a different allele (for example, marker n in Fig. 2A). Allele frequency data were obtained from http://hgdownload.cse.ucsc.edu/goldenPath/hg19/database/. (D) Histogram of the recipient allele frequency for SNP markers that were used to extract the matched error rate (n = 7 patients, all markers). Here, SNPs were selected for which donor and recipient were homozygous and carried the same allele (for example, marker n + 1 in Fig. 2A). (E) Probability of a matched error as function of the recipient allele frequency (n = 42,188 measurements). a.u., arbitrary units.
Fig. 4
Fig. 4. Time dependence of cfdDNA fraction in the absence of rejection, and three examples of acute rejection
(A) Fraction of cfdDNA as function of time after transplant for nine rejection-free heart transplant recipients. Solid line is a fit to a single exponential decay model, y = Ae(−t0) + B. Best-fit values (least squares): A = 5.7, B = 0.075, τ0 = 2.4 days. (B to D) Time course for transplant recipients who suffered from an acute rejection episode. Solid line is fit from (A). (B) An adult recipient with an ACR episode at month 15. (C) An adult recipient who suffered from an ACR episode (month 9) and subsequently required a new heart transplant (month 10). (D) A pediatric heart transplant recipient who suffered from consecutive ACR (months 4 and 12) and AMR (month 5) episodes.
Fig. 5
Fig. 5. Performance of cfdDNA as a marker for heart transplant rejection
(A) Box plots of the fraction of cfdDNA for stable heart transplant recipients (biopsy grade 0), recipients diagnosed with mild rejection (1R/1A ≤ grade < 2R/3A), and recipients diagnosed with moderate-to-severe rejection (grade ≥2R/3A or AMR). P values were determined by Mann-Whitney U test. n is the number of samples for each group. The measured donor fraction was corrected by subtracting a factor aε, where a is the slope of the linear fit in Fig. 3B (a = 3.6) and ε is the measured error rate. (B) ROC analysis of the performance of cfdDNA in classifying moderate-to-severe rejecting (AUC 0.83, black solid line) and nonrejecting recipients (grade 0). Also shown are ROC curves that analyze the performance of the cfdDNA assay in distinguishing moderate-to-severe rejection versus mild rejection events (AUC = 0.75, gray solid line), mild rejections versus the absence of rejection (AUC = 0.6, gray dashed line), and severe rejection events (3B/3R, n = 6) versus the absence of rejection (AUC 0.95, black dashed line). (C) Test performance [AUC, 0 versus moderate-to-severe, black solid line in (B)] as a function of time after transplant, after which samples were taken into account. (D) AUC as a function of the age of the recipient at the time of transplant. (E) Potential for early diagnosis. The donor DNA level before the diagnosis of a moderate-to-severe rejection episode (grade ≥2R/3A or AMR, red data points). Black line, single-exponent fit: y = Ae(t0), with best-fit values (least squares) of A = 1.6 and τ0 = 43 days. Inset: P values for all 1-month time periods tested (Mann-Whitney U test).

Similar articles

Cited by

References

    1. Saraiva F, Matos V, Gonçalves L, Antunes M, Providência L. Complications of endomyocardial biopsy in heart transplant patients: A retrospective study of 2117 consecutive procedures. Transplant Proc. 2011;43:1908–1912. - PubMed
    1. Marboe CC, Billingham M, Eisen H, Deng MC, Baron H, Mehra M, Hunt S, Wohlgemuth J, Mahmood I, Prentice J, Berry G. Nodular endocardial infiltrates (Quilty lesions) cause significant variability in diagnosis of ISHLT grade 2 and 3A rejection in cardiac allograft recipients. J Heart Lung Transplant. 2005;24:S219–S226. - PubMed
    1. Zhang J, Tong KL, Li PK, Chan AY, Yeung CK, Pang CC, Wong TY, Lee KC, Lo YM. Presence of donor- and recipient-derived DNA in cell-free urine samples of renal transplantation recipients: Urinary DNA chimerism. Clin Chem. 1999;45:1741–1746. - PubMed
    1. Lo YM, Tein MS, Pang CC, Yeung CK, Tong KL, Hjelm NM. Presence of donor-specific DNA in plasma of kidney and liver-transplant recipients. Lancet. 1998;351:1329–1330. - PubMed
    1. Sigdel TK, Sarwal MM. Cell-free DNA as a measure of transplant injury. Clin Transpl. 2012:201–205. - PubMed

Publication types