Optimal antisense target reducing INS intron 1 retention is adjacent to a parallel G quadruplex
- PMID: 24944197
- PMCID: PMC4081105
- DOI: 10.1093/nar/gku507
Optimal antisense target reducing INS intron 1 retention is adjacent to a parallel G quadruplex
Abstract
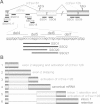
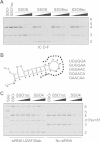
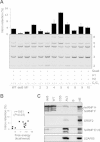
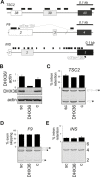
Splice-switching oligonucleotides (SSOs) have been widely used to inhibit exon usage but antisense strategies that promote removal of entire introns to increase splicing-mediated gene expression have not been developed. Here we show reduction of INS intron 1 retention by SSOs that bind transcripts derived from a human haplotype expressing low levels of proinsulin. This haplotype is tagged by a polypyrimidine tract variant rs689 that decreases the efficiency of intron 1 splicing and increases the relative abundance of mRNAs with extended 5' untranslated region (5' UTR), which curtails translation. Co-expression of haplotype-specific reporter constructs with SSOs bound to splicing regulatory motifs and decoy splice sites in primary transcripts revealed a motif that significantly reduced intron 1-containing mRNAs. Using an antisense microwalk at a single nucleotide resolution, the optimal target was mapped to a splicing silencer containing two pseudoacceptor sites sandwiched between predicted RNA guanine (G) quadruplex structures. Circular dichroism spectroscopy and nuclear magnetic resonance of synthetic G-rich oligoribonucleotide tracts derived from this region showed formation of a stable parallel 2-quartet G-quadruplex on the 3' side of the antisense retention target and an equilibrium between quadruplexes and stable hairpin-loop structures bound by optimal SSOs. This region interacts with heterogeneous nuclear ribonucleoproteins F and H that may interfere with conformational transitions involving the antisense target. The SSO-assisted promotion of weak intron removal from the 5' UTR through competing noncanonical and canonical RNA structures may facilitate development of novel strategies to enhance gene expression.
© The Author(s) 2014. Published by Oxford University Press on behalf of Nucleic Acids Research.
Figures


Similar articles
-
Thioflavin T Monitoring of Guanine Quadruplex Formation in the rs689-Dependent INS Intron 1.Mol Ther Nucleic Acids. 2019 Jun 7;16:770-777. doi: 10.1016/j.omtn.2019.04.026. Epub 2019 May 13. Mol Ther Nucleic Acids. 2019. PMID: 31150930 Free PMC article.
-
Allele-specific recognition of the 3' splice site of INS intron 1.Hum Genet. 2010 Oct;128(4):383-400. doi: 10.1007/s00439-010-0860-1. Epub 2010 Jul 14. Hum Genet. 2010. PMID: 20628762 Free PMC article.
-
Antisense targeting of decoy exons can reduce intron retention and increase protein expression in human erythroblasts.RNA. 2020 Aug;26(8):996-1005. doi: 10.1261/rna.075028.120. Epub 2020 Apr 20. RNA. 2020. PMID: 32312846 Free PMC article.
-
The effects of structure on pre-mRNA processing and stability.Methods. 2017 Aug 1;125:36-44. doi: 10.1016/j.ymeth.2017.06.001. Epub 2017 Jun 6. Methods. 2017. PMID: 28595983 Free PMC article. Review.
-
5'-UTR RNA G-quadruplexes: translation regulation and targeting.Nucleic Acids Res. 2012 Jun;40(11):4727-41. doi: 10.1093/nar/gks068. Epub 2012 Feb 20. Nucleic Acids Res. 2012. PMID: 22351747 Free PMC article. Review.
Cited by
-
Targeting natural splicing plasticity of APOBEC3B restricts its expression and mutagenic activity.Commun Biol. 2021 Mar 22;4(1):386. doi: 10.1038/s42003-021-01844-5. Commun Biol. 2021. PMID: 33753867 Free PMC article.
-
RNA G-Quadruplexes in Biology: Principles and Molecular Mechanisms.J Mol Biol. 2017 Jul 7;429(14):2127-2147. doi: 10.1016/j.jmb.2017.05.017. Epub 2017 May 26. J Mol Biol. 2017. PMID: 28554731 Free PMC article. Review.
-
Thioflavin T Monitoring of Guanine Quadruplex Formation in the rs689-Dependent INS Intron 1.Mol Ther Nucleic Acids. 2019 Jun 7;16:770-777. doi: 10.1016/j.omtn.2019.04.026. Epub 2019 May 13. Mol Ther Nucleic Acids. 2019. PMID: 31150930 Free PMC article.
-
Intron retention as a component of regulated gene expression programs.Hum Genet. 2017 Sep;136(9):1043-1057. doi: 10.1007/s00439-017-1791-x. Epub 2017 Apr 8. Hum Genet. 2017. PMID: 28391524 Free PMC article. Review.
-
Site-Specific Fluorophore Labeling of Guanosines in RNA G-Quadruplexes.ACS Omega. 2019 May 14;4(5):8472-8479. doi: 10.1021/acsomega.9b00704. eCollection 2019 May 31. ACS Omega. 2019. PMID: 31459936 Free PMC article.
References
-
- Smith C.W., Valcarcel J. Alternative pre-mRNA splicing: the logic of combinatorial control. Trends Biochem. Sci. 2000;25:381–388. - PubMed
-
- Wahl M.C., Will C.L., Luhrmann R. The spliceosome: design principles of a dynamic RNP machine. Cell. 2009;136:701–718. - PubMed
-
- Callis J., Fromm M., Walbot V. Introns increase gene expression in cultured maize cells. Genes Dev. 1987;1:1183–1200. - PubMed
-
- Le Hir H., Nott A., Moore M.J. How introns influence and enhance eukaryotic gene expression. Trends Biochem. Sci. 2003;28:215–220. - PubMed
Publication types
MeSH terms
Substances
LinkOut - more resources
Full Text Sources
Other Literature Sources

