. 2014 Aug 15;307(4):F369-84.
doi: 10.1152/ajprenal.00127.2014. Epub 2014 Jun 18.

Magnesium protects against cisplatin-induced acute kidney injury by regulating platinum accumulation

Affiliations

Magnesium protects against cisplatin-induced acute kidney injury by regulating platinum accumulation

Malvika H Solanki et al. Am J Physiol Renal Physiol. .

Abstract

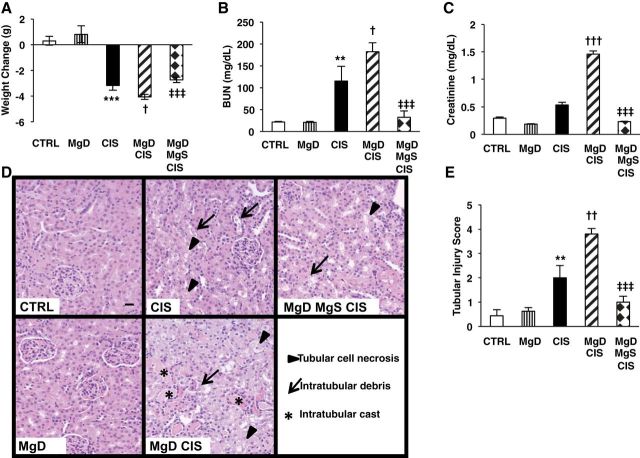
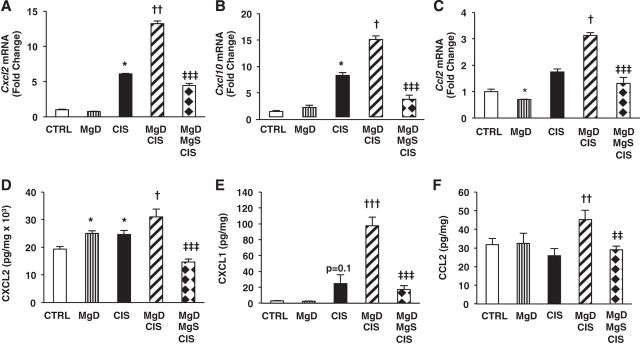
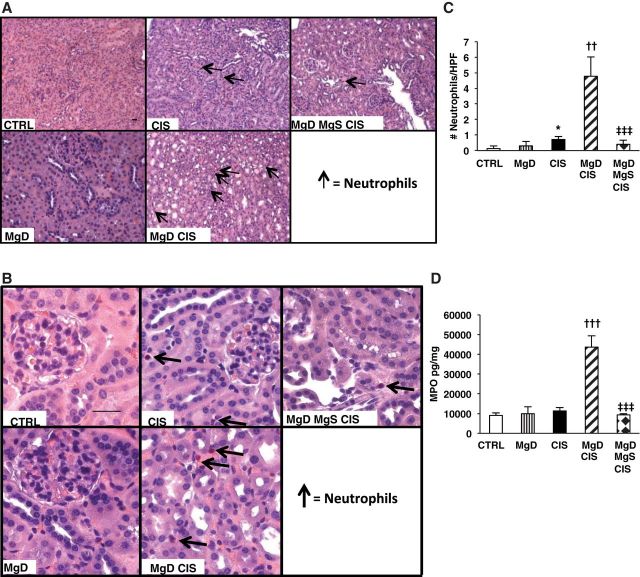
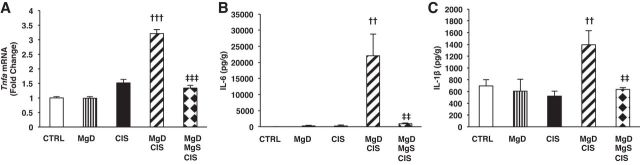
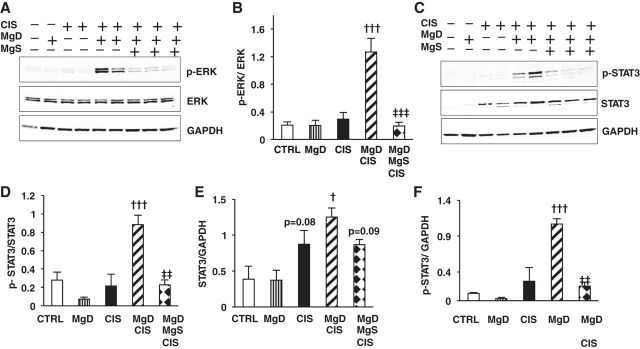
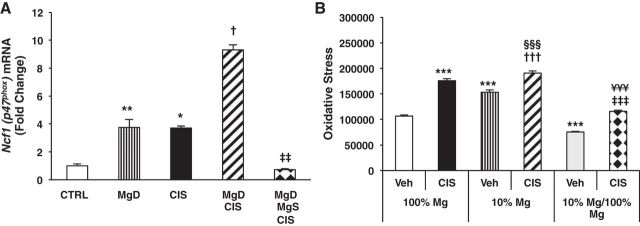
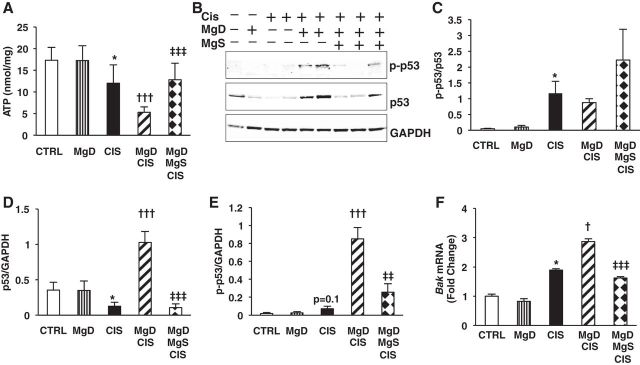
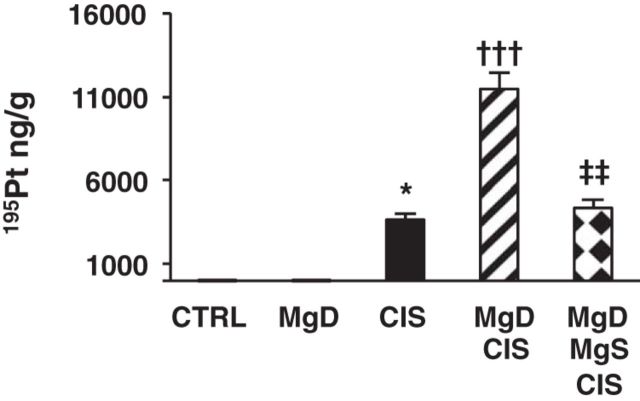
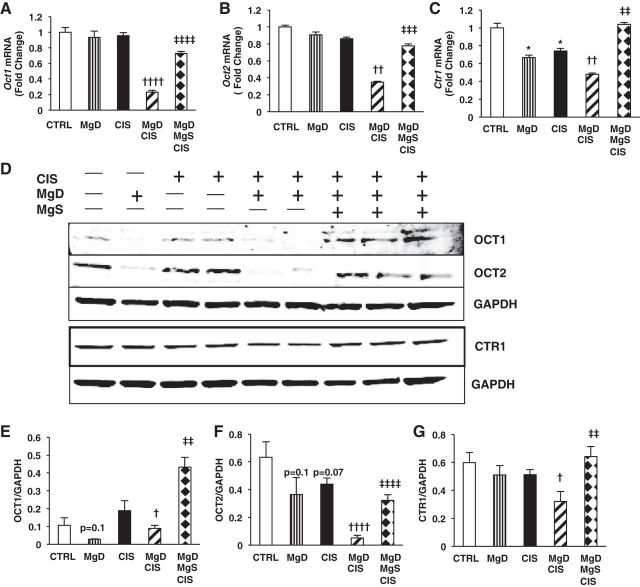
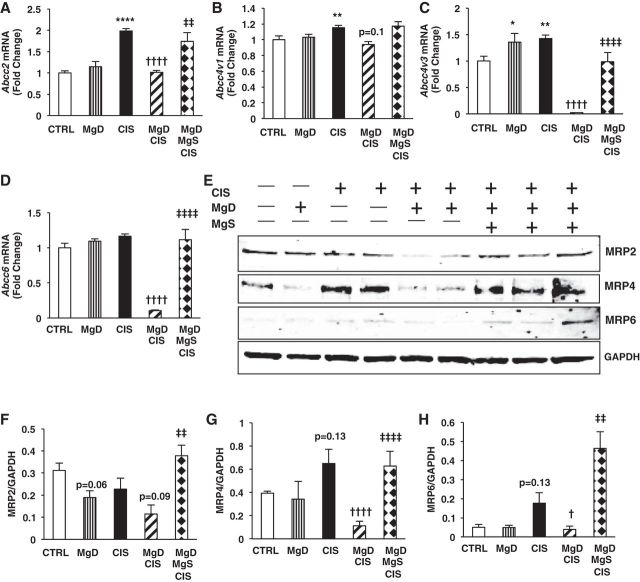
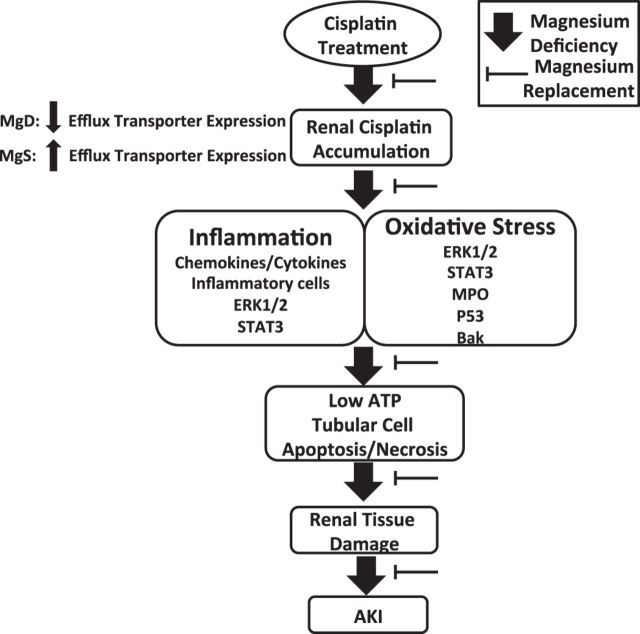
Despite its success as a potent antineoplastic agent, ∼25% of patients receiving cisplatin experience acute kidney injury (AKI) and must discontinue therapy. Impaired magnesium homeostasis has been linked to cisplatin-mediated AKI, and because magnesium deficiency is widespread, we examined the effect of magnesium deficiency and replacement on cisplatin-induced AKI in physiologically relevant older female mice. Magnesium deficiency significantly increased cisplatin-associated weight loss and markers of renal damage (plasma blood urea nitrogen and creatinine), histological changes, inflammation, and renal cell apoptosis and modulated signaling pathways (e.g., ERK1/2, p53, and STAT3). Conversely, these damaging effects were reversed by magnesium. Magnesium deficiency alone significantly induced basal and cisplatin-mediated oxidative stress, whereas magnesium replacement attenuated these effects. Similar results were observed using cisplatin-treated LLC-PK1 renal epithelial cells exposed to various magnesium concentrations. Magnesium deficiency significantly amplified renal platinum accumulation, whereas magnesium replacement blocked the augmented platinum accumulation after magnesium deficiency. Increased renal platinum accumulation during magnesium deficiency was accompanied by reduced renal efflux transporter expression, which was reversed by magnesium replacement. These findings demonstrate the role of magnesium in regulating cisplatin-induced AKI by enhancing oxidative stress and thus promoting cisplatin-mediated damage. Additional in vitro experiments using ovarian, breast, and lung cancer cell lines showed that magnesium supplementation did not compromise cisplatin's chemotherapeutic efficacy. Finally, because no consistently successful therapy to prevent or treat cisplatin-mediated AKI is available for humans, these results support developing more conservative magnesium replacement guidelines for reducing cisplatin-induced AKI in cancer patients at risk for magnesium deficiency.

Keywords: apoptosis; hypomagnesemia; inflammation; nephrotoxicity; oxidative stress.


Figures

Fig. 1.
Fig. 1.
Magnesium (Mg) deficiency before cisplatin (CIS) treatment enhances and Mg supplementation protects against CIS-induced weight loss and kidney damage. Mice were maintained on either 100% Mg or 10% Mg-deficient (MgD) diets, as described in methods, and then treated with either saline [control (CTRL)] or CIS (12 mg/kg). Another group of mice maintained on 10% Mg was switched to the 100% Mg diet and given a Mg-supplemented (MgS) diet, as described in methods. A: changes in weight from just before CIS to 48 hrs post-CIS. B and C: all mice were euthanized 48 h post-CIS (or saline), and blood urea nitrogen (BUN; B) and plasma creatinine levels (C) were determined. Data are shown as means ± SE (in mg/dl). Fixed kidney tissues were stained with hematoxylin and eosin and evaluated for histology. D: representative images for each group (×200 magnification). E: histological damage scores (ranging between 0 and 4) were based on the percentage of tubules affected (0 = <10%, 1 = 10–25%, 2 = 26–50%, 3 = 51–75%, and 4 = >75%). Data are shown as means ± SE. Scale bar = 20 μm. **P < 0.01 vs. CTRL; ***P < 0.001 vs. CTRL; †P < 0.05 vs. CIS; ††P < 0.01 vs. CIS; †††P < 0.001 vs. CIS; ‡‡‡P < 0.001 vs. MgD + CIS.
Fig. 2.
Fig. 2.
CIS-induced renal chemokine expression is upregulated by Mg deficiency and downregulated by Mg replacement. Mice were maintained on either 100% Mg or 10% Mg-deficient diets or were maintained on a 10% Mg diet followed by Mg supplementation, as described in methods, and then treated with saline (CTRL) or CIS (12 mg/kg). A–C: all mice were euthanized 48 h post-CIS (or saline), and chemokine (C-X-C motif) ligand (Cxcl)2 (A), Cxcl10 (B), and chemokine (C-C motif) ligand (Ccl2)2 (C) mRNA expression in renal cortical tissues was measured by quantitative PCR. Data are shown as means ± SE (in fold changes vs. Gapdh). D–F: CXCL2 (D), CXCL1 (E), and CCL2 (F) renal protein levels were measured by Meso Scale Discovery (MSD)/ELISA. Data are shown as means ± SE (per mg protein). *P < 0.05 vs. CTRL; †P < 0.05 vs. CIS; ††P < 0.01 vs. CIS; †††P < 0.001 vs. CIS; ‡‡P < 0.01 vs. MgD + CIS; ‡‡‡P < 0.001 vs. MgD + CIS; P = 0.1 vs. CTRL.
Fig. 3.
Fig. 3.
CIS treatment after Mg deficiency is associated with enhanced neutrophil infiltration and renal myeloperoxidase (MPO). Mice were maintained on either 100% Mg or 10% Mg-deficient diets or were maintained on a 10% Mg diet followed by Mg supplementation, as described in methods, and then treated with saline (CTRL) or CIS (12 mg/kg). All mice were euthanized 48 h post-CIS (or saline); fixed kidney tissues were evaluated for neutrophils by Leder staining. A and B: representative images for each group at ×200 (A) and ×400 (B) magnification. C: mean numbers of neutrophils per high-power field (HPF) ± SE. D: frozen renal tissues were analyzed for MPO. Data are shown as mean MPO concentrations ± SE (in pg/mg protein). Scale bars = 20 μm. *P < 0.05 vs. CTRL; ††P < 0.01 vs. CIS; †††P < 0.001 vs. CIS; ‡‡‡P < 0.001 vs. MgD + CIS.
Fig. 4.
Fig. 4.
Mg deficiency before CIS treatment upregulates the expression of renal cytokines: reversal by Mg replacement. Mice were maintained on either 100% Mg or 10% Mg-deficient diets or were maintained on a 10% Mg diet followed by Mg supplementation, as described in methods, and then treated with saline (CTRL) or CIS (12 mg/kg). A: all mice were euthanized 48 h post-CIS (or saline), and renal TNF-α (Tnfa) mRNA expression in renal cortical tissues was measured using quantitative PCR. Data are shown as means ± SE (in fold changes vs. Gapdh). B and C: IL-6 (B) and IL-1β (C) renal protein levels were measured by MSD. Data are shown as mean cytokine concentrations ± SE (in pg/g protein). ††P < 0.01 vs. CIS; †††P < 0.001 vs. CIS; ‡‡P < 0.01 vs. MgD + CIS; ‡‡‡P < 0.001 vs. MgD + CIS.
Fig. 5.
Fig. 5.
Mg status regulates CIS-induced activation of ERK1/2 and STAT3 inflammatory signaling pathways. Mice were maintained on either 100% Mg or 10% Mg-deficient diets or were maintained on a 10% Mg diet followed by Mg supplementation, as described in methods, and then treated with saline (CTRL) or CIS (12 mg/kg). All mice were euthanized 48 h post-CIS (or saline), and ERK1/2 and STAT3 protein expression and phosphorylation in renal cortical tissues were measured by Western blot analysis. GAPDH, total ERK1/2, and total STAT3 were used as loading controls. A: representative blots for ERK1/2. B: quantitation of phosphorylated (p-)ERK-to-total ERK1/2 band densities (means ± SE). C: representative blots for STAT3 (total STAT3), p-STAT3 (Tyr305), and GAPDH. D–F: quantitation of p-STAT3-to-total STAT3 (D), total STAT3-to-GAPDH (E), and p-STAT3-to-GAPDH (F) band densities. All data are expressed as mean band densities ± SE. †P < 0.05 vs. CIS; †††P < 0.001 vs. CIS; ‡‡P < 0.01 vs. MgD + CIS; ‡‡‡P < 0.001 vs. MgD + CIS; P = 0.08 vs. CTRL; P = 0.09 vs. MgD + CIS.
Fig. 6.
Fig. 6.
Mg deficiency upregulates and Mg supplementation downregulates basal and CIS-induced oxidative stress in vivo and in renal epithelial cells. Mice were maintained on either 100% Mg or 10% Mg-deficient diets or were maintained on a 10% Mg diet followed by Mg supplementation, as described in methods, and then treated with either saline (CTRL) or CIS (12 mg/kg). A: all mice were euthanized 48 h post-CIS (or saline), and neutrophil cytosolic factor 1 (Ncf1) mRNA expression in renal cortical tissues was measured using quantitative PCR. Data are shown as means ± SE (in fold changes vs. Gapdh). *P < 0.05 vs. CTRL; **P < 0.01 vs. CTRL; †P < 0.05 vs. CIS; ‡‡P < 0.01 vs. MgD + CIS. B: LLC-PK1 renal epithelial cells were grown in either 100% Mg media, 10% Mg (deficient) media, or 10% Mg media followed by 100% Mg (10% Mg/100% Mg) media for 4 days and then treated with MEM [vehicle (Veh)] or CIS (83.3 μM) and assayed for oxidative stress using a 2′,7′-Dichlorodihydrofluorescein diacetate assay. Data are shown as mean oxidative stress (or fluorescence) ± SD. ***P < 0.001 vs. Veh + 100% Mg; †††P < 0.001 vs. Veh + 10% Mg; ‡‡‡P < 0.001 vs. Veh + 10% Mg/100% Mg; §§§P < 0.001 vs. CIS + 100% Mg; ¥¥¥P < 0.001 vs. CIS + 10% Mg.
Fig. 7.
Fig. 7.
Mg deficiency before CIS treatment enhances renal ATP depletion, activation of the p53 proapoptotic signaling pathway, and Bak mRNA expression in vivo: reversed by Mg replacement. Mice were maintained on either 100% Mg or 10% Mg-deficient diets or were maintained on a 10% Mg diet followed by Mg supplementation, as described in methods, and then treated with saline (CTRL) or CIS (12 mg/kg). All mice were euthanized 48 h post-CIS (or saline). A: renal ATP levels [shown as mean ATP concentrations ± SD (in nmol/mg), corrected for protein levels]. B: kidney total p53 and p-p53 (Ser15) were measured by Western blot analysis. GAPDH and total p53 were used as loading controls. Representative blots are shown. C–E: ratios of p-p53 to total p53 (C), total p53 to GAPDH (D), and p-p53 to GAPDH (E) are shown as band densities (means ± SEM). F: renal Bak mRNA expression was measured using quantitative PCR and expressed as means ± SE (in fold changes vs. Gapdh). *P < 0.05 vs. CTRL; †P < 0.05 vs. CIS; †††P < 0.001 vs. CIS; ‡‡P < 0.01 vs. MgD + CIS; ‡‡‡P < 0.001 vs. MgD + CIS; P = 0.1 vs. CTRL.
Fig. 8.
Fig. 8.
Mg deficiency enhances CIS-induced renal cell apoptosis in vivo and increases CIS-mediated killing of LLC-PK1 cells: reversal by Mg replacement. Mice were maintained on either 100% Mg or 10% Mg-deficient diets or were maintained on a 10% Mg diet followed by Mg supplementation, as described in methods, and then treated with saline (CTRL) or CIS (12 mg/kg). All mice were euthanized 48h post-CIS (or saline). Renal apoptosis was measured by TUNEL staining. A and B: representative photomicrographs (at ×200 magnification) in a complete representative section (A) and a selected area in the section (B). C: apoptosis was determined by counting the number of TUNEL-positive cells per HPF using random sections, and mean apoptosis scores ± SE are shown. Scale bar = 20 μm. *P < 0.05 vs. CTRL; †P < 0.05 vs. CIS; ‡‡‡P < 0.001 vs. MgD + CIS. D: LLC-PK1 cells were maintained in either 100% Mg or 10% Mg (Mg-deficient) media or 10% Mg media followed by 200% Mg replacement (10% Mg/200% Mg). Cell viability was measured 24 h post-CIS using a neutral red assay, and data are shown as means ± SD (as %viability). ***P < 0.001 vs. 100% Mg + CIS; ‡‡‡P < 0.001 vs. 10% Mg + CIS.
Fig. 9.
Fig. 9.
CIS-induced renal platinum accumulation is enhanced by Mg deficiency and decreased by Mg replacement. Mice were maintained on either 100% Mg or 10% Mg-deficient diets or were maintained on a 10% Mg diet followed by Mg supplementation, as described in methods, and then treated with saline (CTRL) or CIS (12 mg/kg). All mice were euthanized 48 h post-CIS (or saline), and renal platinum (195Pt) accumulation, as measured by inductively coupled plasma mass spectrometry, is shown as means ± SE (in ng/g kidney tissue). *P < 0.05 vs. CTRL; †††P < 0.001 vs. CIS; ‡‡ P < 0.01 vs. MgD + CIS.
Fig. 10.
Fig. 10.
Mg status regulates CIS uptake transporter expression in the kidneys. Mice were maintained on either 100% Mg or 10% Mg-deficient diets or were maintained on a 10% Mg diet followed by Mg supplementation, as described in methods, and then treated with saline (CTRL) or CIS (12 mg/kg). All mice were euthanized 48 h post-CIS (or saline), and renal cortical tissues were assessed for uptake transporter mRNA expression by quantitative PCR. A: organic cation transporter (Oct)1. B: Oct2. C: copper transporter 1 (Ctr1). Data are shown as means ± SE (in fold changes vs. Gapdh). D: representative Western blots showing renal OCT1, OCT2, and CTR1 protein expression. E–G: quantitation of band ratios for OCT1 to GAPDH (E), OCT2 to GAPDH (F), and CTR1 to GAPDH (G). Mean band densities ± SE are shown. * P < 0.05 vs. CTRL, † P < 0.05 vs. CIS, †† P < 0.01 vs. CIS, †††† P < 0.0001 vs. CIS, ‡‡ P < 0.01 vs. MgD CIS, ‡‡‡ P < 0.001 vs. MgD CIS, ‡‡‡‡ P < 0.0001 vs. MgD CIS, P = 0.1 vs. CTRL, P = 0.07 vs. CTRL.
Fig. 11.
Fig. 11.
Mg status regulates CIS efflux transporter expression in the kidneys. Mice were maintained on either 100% Mg or 10% Mg-deficient diets or were maintained on a 10% Mg diet followed by Mg supplementation, as described in methods, and then treated with saline (CTRL) or CIS (12 mg/kg). All mice were euthanized 48 h post-CIS (or saline), and renal efflux transporter mRNA expression was measured by quantitative PCR. A: ATP-binding cassette subfamily C (ABCC)2. B: Abcc4v1. C: Abcc4v3. D: Abcc6. Data are shown as means ± SE (in fold changes vs. Gapdh). E: representative Western blots for renal ABCC2 [multidrug resistance protein (MRP)2], ABCC6 (MRP6), and ABCC4 (MRP4) expression. F–H: quantitation of band ratios of ABCC2 (MRP2) to GAPDH (F), ABCC4 (MRP4) to GAPDH (G), and ABCC6 (MRP6) to GAPDH (H). Mean band densities ± SE are shown. *P < 0.05 vs. CTRL; **P < 0.01 vs. CTRL; ****P < 0.0001 vs. CTRL; †P < 0.05 vs. CIS; ††††P < 0.0001 vs. CIS; ‡‡P < 0.01 vs. MgD + CIS; ‡‡‡‡P < 0.0001 vs. MgD + CIS; P = 0.06 vs. CTRL; P = 0.13 vs. CTRL; P = 0.09 vs. CIS; P = 0.1 vs. CIS.
Fig. 12.
Fig. 12.
Proposed mechanisms by which Mg regulates CIS-induced acute kidney injury (AKI). Mg deficiency leads to enhanced renal CIS accumulation via decreased efflux transporter expression and increased CIS-induced inflammation and oxidative stress with reduced ATP levels in the kidneys. Activated signaling pathways, including ERK1/2, STAT3, and p53, associated with inflammation and oxidative stress merge to promote renal cell apoptosis/necrosis, resulting in renal tissue damage and, ultimately, AKI. Mg replacement after Mg deficiency protects against CIS-induced AKI by decreasing CIS accumulation, increasing efflux transporter expression, inflammation, oxidative stress, and the activation of pathways that lead to kidney cell apoptosis/necrosis.

References

    1. Aleksunes LM, Augustine LM, Scheffer GL, Cherrington NJ, Manautou JE. Renal xenobiotic transporters are differentially expressed in mice following cisplatin treatment. Toxicology : 82–88, 2008. - PMC - PubMed
    1. Anderson S, Eldadah B, Halter JB, Hazzard WR, Himmelfarb J, Horne FM, Kimmel PL, Molitoris BA, Murthy M, O'Hare AM, Schmader KE, High KP. Acute kidney injury in older adults. J Am Soc Nephrol : 28–38, 2011. - PubMed
    1. Aoki M, Terada T, Kajiwara M, Ogasawara K, Ikai I, Ogawa O, Katsura T, Inui K. Kidney-specific expression of human organic cation transporter 2 (OCT2/SLC22A2) is regulated by DNA methylation. Am J Physiol Renal Physiol : F165–F170, 2008. - PubMed
    1. Arnaud MJ. Update on the assessment of magnesium status. Br J Nutr Suppl : S24–S36, 2008. - PubMed
    1. Ashrafi F, Haghshenas S, Nematbakhsh M, Nasri H, Talebi A, Eshraghi-Jazi F, Pezeshki Z, Safari T. The role of magnesium supplementation in cisplatin-induced nephrotoxicity in a rat model: no nephroprotectant effect. Int J Prev Med : 637–643, 2012. - PMC - PubMed

Publication types

MeSH terms

LinkOut - more resources