. 2014 Mar 31;6(3):26.
doi: 10.1186/gm543. eCollection 2014.

Choice of transcripts and software has a large effect on variant annotation

Affiliations

Choice of transcripts and software has a large effect on variant annotation

Davis J McCarthy et al. Genome Med. .

Abstract

Background: Variant annotation is a crucial step in the analysis of genome sequencing data. Functional annotation results can have a strong influence on the ultimate conclusions of disease studies. Incorrect or incomplete annotations can cause researchers both to overlook potentially disease-relevant DNA variants and to dilute interesting variants in a pool of false positives. Researchers are aware of these issues in general, but the extent of the dependency of final results on the choice of transcripts and software used for annotation has not been quantified in detail.

Methods: This paper quantifies the extent of differences in annotation of 80 million variants from a whole-genome sequencing study. We compare results using the RefSeq and Ensembl transcript sets as the basis for variant annotation with the software Annovar, and also compare the results from two annotation software packages, Annovar and VEP (Ensembl's Variant Effect Predictor), when using Ensembl transcripts.

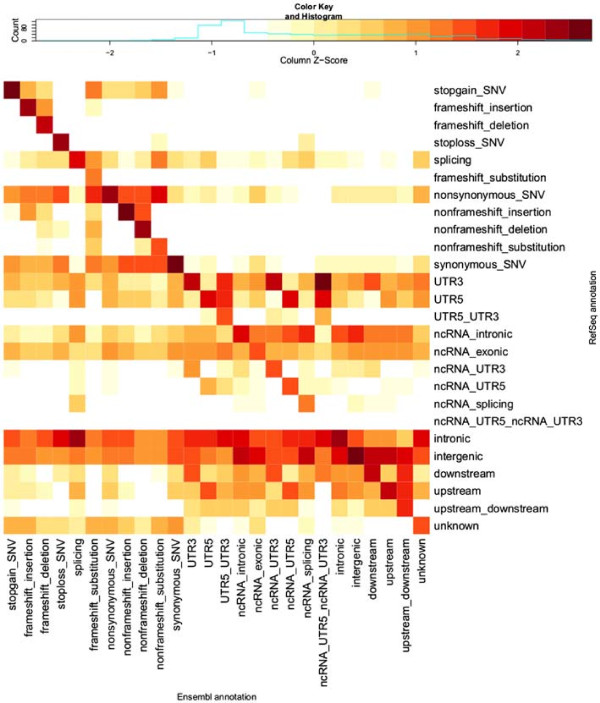
Results: We found only 44% agreement in annotations for putative loss-of-function variants when using the RefSeq and Ensembl transcript sets as the basis for annotation with Annovar. The rate of matching annotations for loss-of-function and nonsynonymous variants combined was 79% and for all exonic variants it was 83%. When comparing results from Annovar and VEP using Ensembl transcripts, matching annotations were seen for only 65% of loss-of-function variants and 87% of all exonic variants, with splicing variants revealed as the category with the greatest discrepancy. Using these comparisons, we characterised the types of apparent errors made by Annovar and VEP and discuss their impact on the analysis of DNA variants in genome sequencing studies.

Conclusions: Variant annotation is not yet a solved problem. Choice of transcript set can have a large effect on the ultimate variant annotations obtained in a whole-genome sequencing study. Choice of annotation software can also have a substantial effect. The annotation step in the analysis of a genome sequencing study must therefore be considered carefully, and a conscious choice made as to which transcript set and software are used for annotation.


Figures

Figure 1
Figure 1
Annotation examples. These screenshots from the ENSEMBL web browser [40] show two examples of variant annotation. (A) The variant NC_000011.9:g.57983194A>G (rs7103033) is relatively straightforward to annotate. It is the final base of the final exon in both transcripts at this position (a CCDS transcript (green) and a ‘merged’ ENSEMBL/Havana (GENCODE) transcript (gold)). The final codon has changed from TGA (stop codon) to TGG (tryptophan), so this is unambiguously a stop-loss variant. Using the ENSEMBL transcript set, both ANNOVAR and VEP correctly annotate this variant as stop-loss. (B) The variant NC_000006.11:g.30558477_30558478insA (rs72545970) is more difficult to annotate. It is the penultimate base of the exon for all but one of the transcripts shown. It is a single-base insertion, so could be annotated as a frameshift variant. Then again, it is an insertion in a stop codon, so could be a stop-loss variant. In fact, the final codon, TGA (stop codon), remains TGA with this variant (insertion of a single base A), so it is actually a synonymous variant. ANNOVAR annotates it as frameshift insertion and VEP as stop-loss, when using ENSEMBL transcripts. Each browser image consists of several tracks, which provide base-resolution information about the DNA sequence. Two tracks, ‘Sequence (+)’ and ‘Sequence (-)’, show the DNA sequence on the forward and reverse strands, respectively. Above these, a track shows start and stop codons, and above that, several tracks indicate the presence and structure of different transcripts (labelled as ‘Genes’ and ‘CCDS set’; transcripts are read from left to right). The ‘hollowed-out’ parts of transcripts indicate non-coding sequences. Below the DNA sequence, the track ‘Sequence variant’ shows known sequence variants from dbSNP [17] and the 1000 Genomes Project [18]. The ‘Variation Legend’ and ‘Gene Legend’ provide more information about features shown in different colours in the browser. CCDS, Consensus Coding Sequence; UTR, untranslated region.
Figure 2
Figure 2
REFSEQ-normalised heatmap of annotation comparison. This heatmap shows scaled numbers of variants (log10 transformation with offset of 1 applied) for all different combinations of ANNOVAR categories of annotations when using the ENSEMBL transcript set (columns) and REFSEQ transcript set (rows). Values are Z-scaled (mean-centred, divided by standard deviation) by row (each row is scaled separately; contrast with Figure 3). The key above the heatmap shows the values indicated by different colours. This row-normalised heatmap allows us to see which categories of annotation are over-represented (relative to the total number of variants in the column/category) in the ENSEMBL annotations for each category (i.e. row) of REFSEQ annotation. Ideally, all of the dark red squares would lie on the diagonal, with white squares on the off-diagonals, indicating complete agreement in the annotations from the two transcript sets. Compare with Additional file 1: Table S1, which provides the numbers used for this heatmap. Categories are ordered as per Table 1.
Figure 3
Figure 3
ENSEMBL-normalised heatmap of annotation comparisons. This heatmap shows scaled numbers of variants (log10 transformation with offset of 1 applied) for all different combinations of ANNOVAR categories of annotations when using the ENSEMBL transcript set (columns) and REFSEQ transcript set (rows). Values are Z-scaled (mean-centred, divided by standard deviation) by column (each column is scaled separately; contrast with Figure 2). The key above the heatmap shows the values indicated by different colours. The column-normalised heatmap allows us to see which categories of annotation are over-represented (relative to the total number of variants in the column/category) in the REFSEQ annotations for each category (i.e. column) of ENSEMBL annotation. Ideally, all of the dark red squares would lie on the diagonal, with white squares on the off-diagonals, indicating complete agreement in the annotations when using the two transcript sets. Compare with Additional file 1: Table S1, which provides the numbers used for this heatmap. Categories are ordered as per Table 1.

References

    1. Green E, Guyer M. NHGR Institute. Charting a course for genomic medicine from base pairs to bedside. Nature. 2011;470:204–213. doi: 10.1038/nature09764. - DOI - PubMed
    1. Schrijver I, Aziz N, Farkas D, Furtado M, Gonzalez A, Greiner T, Grody W, Hambuch T, Kalman L, Kant J, Klein R, Leonard D, Lubin I, Mao R, Nagan N, Pratt V, Sobel M, Voelkerding K, Gibson J. Opportunities and challenges associated with clinical diagnostic genome sequencing: a report of the association for molecular pathology. J Mol Diagn. 2012;14:525–540. doi: 10.1016/j.jmoldx.2012.04.006. - DOI - PMC - PubMed
    1. Cooper G, Stone E, Asimenos G, Green E, Batzoglou S, Sidow A. NCS Program. Distribution and intensity of constraint in mammalian genomic sequence. Genome Res. 2005;15:901–913. doi: 10.1101/gr.3577405. - DOI - PMC - PubMed
    1. Kumar P, Henikoff S, Ng PC. Predicting the effects of coding non-synonymous variants on protein function using the SIFT algorithm. Nat Protoc. 2009;4:1073–1081. doi: 10.1038/nprot.2009.86. - DOI - PubMed
    1. Adzhubei IA, Schmidt S, Peshkin L, Ramensky VE, Gerasimova A, Bork P, Kondrashov AS, Sunyaev SR. A method and server for predicting damaging missense mutations. Nat Methods. 2010;7:248–249. doi: 10.1038/nmeth0410-248. - DOI - PMC - PubMed