. 2014 Feb 19;3(4):394-407.
doi: 10.1016/j.molmet.2014.01.014. eCollection 2014 Jul.

Rictor/mTORC2 facilitates central regulation of energy and glucose homeostasis

Affiliations

Rictor/mTORC2 facilitates central regulation of energy and glucose homeostasis

Heidi E Kocalis et al. Mol Metab. .

Abstract

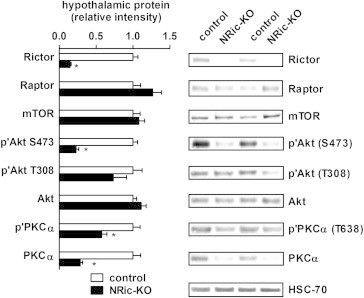
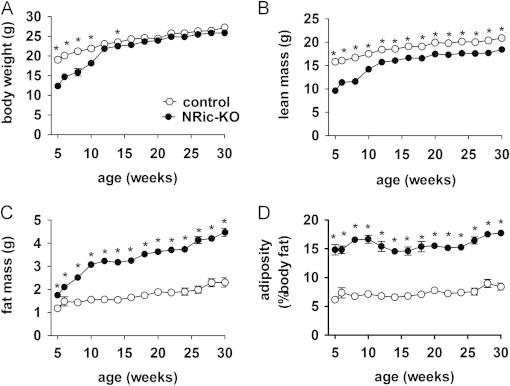
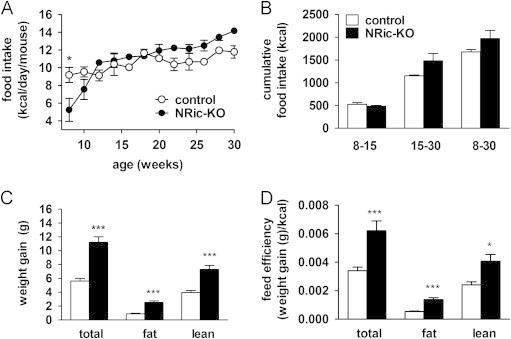
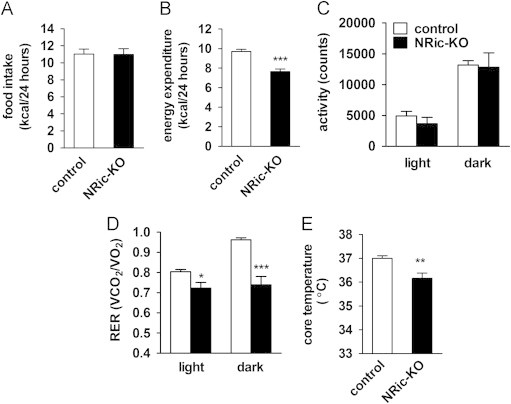
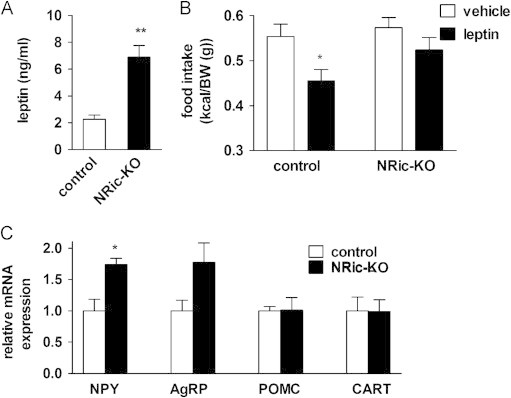
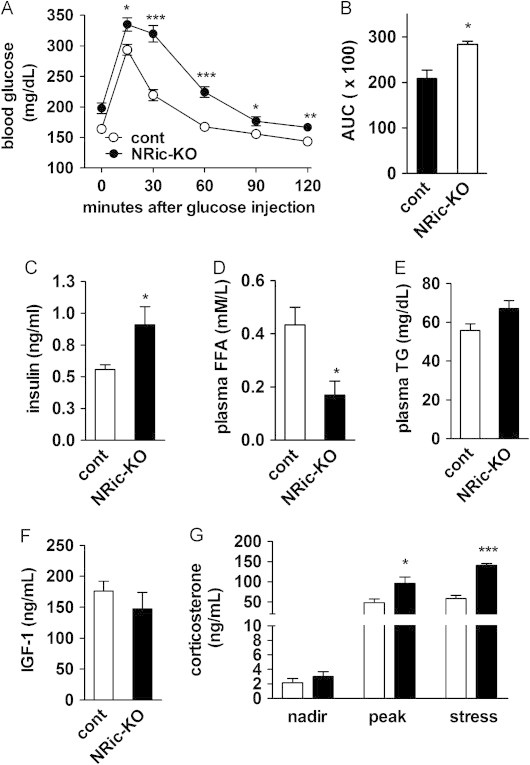
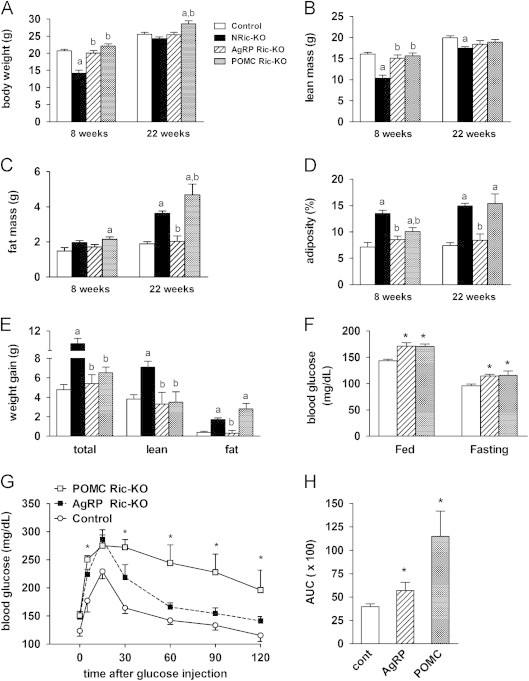
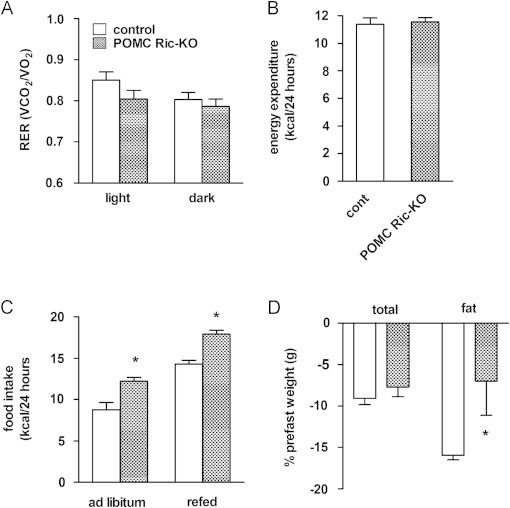
Insulin signaling in the central nervous system (CNS) regulates energy balance and peripheral glucose homeostasis. Rictor is a key regulatory/structural subunit of the mTORC2 complex and is required for hydrophobic motif site phosphorylation of Akt at serine 473. To examine the contribution of neuronal Rictor/mTORC2 signaling to CNS regulation of energy and glucose homeostasis, we utilized Cre-LoxP technology to generate mice lacking Rictor in all neurons, or in either POMC or AgRP expressing neurons. Rictor deletion in all neurons led to increased fat mass and adiposity, glucose intolerance and behavioral leptin resistance. Disrupting Rictor in POMC neurons also caused obesity and hyperphagia, fasting hyperglycemia and pronounced glucose intolerance. AgRP neuron specific deletion did not impact energy balance but led to mild glucose intolerance. Collectively, we show that Rictor/mTORC2 signaling, especially in POMC-expressing neurons, is important for central regulation of energy and glucose homeostasis.

Keywords: AgRP neurons; CNS insulin; Energy balance; Food intake; Obesity; POMC neurons; Rictor; mTORC2.


Figures

Figure 1
Figure 1
Neuronal Rictor expression is required for hypothalamic Akt and PKCα signaling. Mediobasal hypothalamic total protein extracts from NRic-KO mice and control mice were subjected to Western blot analysis and probed with the indicated primary antibodies. Levels of heat shock cognate protein 70 (HSC70) were determined and used as a loading control. Phosphorylated and total protein levels were determined by densitometry and used to calculate the phosphorylation index of activation for Akt and protein kinase C alpha (PKCα). Values represent the mean±SEM of 6–8 animals of each genotype. ∗ p<0.05.
Figure 2
Figure 2
Regulation of body weight and adiposity by neuronal Rictor. (A) Body weight was measured in NRic-KO (filled circles) and control mice (open circles) at the indicated ages, from 5–30 weeks of age. (B) Lean and (C) total body fat mass were determined by NMR. (D) Adiposity (% body fat) was calculated ((fat mass/total body weight)×100). Values represent the mean±SEM of 6–8 animals of each genotype. ∗ p<0.05.
Figure 3
Figure 3
Energy intake and weight gain in NRic-KO mice. (A) Food intake was measured in NRic-KO (filled circles) and control mice (open circles) and is expressed as the average daily intake of genotype matched, group housed mice (2–3 mice/cage). (B) Cumulative food intake (kcal) over 22 weeks (8–30 weeks of age) is shown as well as for young mice (8–15 weeks of age) and adults (15–30 weeks old) (n=3/group). (C) Weight gained between the ages of 8–30 weeks is shown for total body, fat and lean mass by mice of the indicated genotypes. (D) Feed efficiency over the corresponding 22 week period was calculated (change in total body weight, fat or lean mass (g)/(cumulative kcal consumed)) for mice of the indicated genotypes. Values represent the mean±SEM of 6–8 animals of each genotype. ∗∗∗ p<0.001, ∗∗ p<0.01, ∗ p<0.05.
Figure 4
Figure 4
Assessment of energy balance parameters in NRic-KO mice. (A) Daily food intake is illustrated for individually housed, 12-week-old NRic-KO and control mice. (B) Daily energy expenditure was monitored using the Oxymax/CLAMS indirect calorimetry system in 12-week-old mice of the indicated genotypes. (C) Total activity in light and dark periods in mice of the indicated genotypes is depicted. (D) Respiratory exchange ratio (RER) (VCO2/VO2) during the light and dark periods is shown. (E) Core body temperature measured during the light phase in mice of the indicated genotypes. Values represent mean±SEM of 4–5 animals of each genotype. ∗∗∗ p<0.001, ∗∗ p<0.01, ∗ p<0.05.
Figure 5
Figure 5
Leptin sensitivity and hypothalamic neuropeptide mRNA expression. (A) Plasma leptin levels of 9-week-old NRic-KO and control mice were measured. (B) Leptin tolerance tests were performed in 9-week-old mice of the indicated genotypes. Following leptin treatment (5 μg/g body weight, IP), food intake was measured in individually housed mice over 24 h and is shown normalized to body weight. (C) Hypothalamic neuropeptide mRNA levels of mice of the indicated genotypes were measured. Target gene mRNA levels were normalized to endogenous RPL13A levels, and then expressed relative to that of the control group. Values represent the mean±SEM of 5–7 animals of each genotype. (A and C) ∗∗ p<0.01, ∗ p<0.05 vs. control or (B) ∗ p<0.05 vs. genotype matched vehicle control.
Figure 6
Figure 6
Glucose homeostasis, plasma hormone and metabolite levels as well as HPA axis function in NRic-KO mice. (A) Glucose tolerance tests were performed in 9-week-old NRic-KO (filled circle) and control mice (open circles). (B) Quantitation of area under the glucose curve (AUC) analysis is shown from glucose tolerance testing. (C) Non-fasting plasma insulin, (D) free fatty acid (FFA), and (E) triglyceride (TG) levels of 9-week-old mice of the indicated genotypes were measured. (F) Insulin-like growth factor 1 (IGF-1) levels were measured in 18-week-old mice of the indicated genotypes. (G) Circadian and handling stress induced plasma corticosterone levels of 18-week-old mice of the indicated genotypes were measured. Nadir (8 am), peak (5 pm) and mild handling stress induced samples were collected 3 days apart. Values represent the mean±SEM of 6–8 animals of each genotype. ∗∗∗ p<0.001, ∗∗ p<0.01, ∗ p<0.05.
Figure 7
Figure 7
Regulation of adiposity and glucose homeostasis by Rictor in POMC neurons. (A) Body weight, (B) lean mass, (C) fat mass and (D) adiposity (% body fat, calculated as (fat mass/total body weight)×100), and (E) increase in total body, fat and lean mass was measured in NRic-KO, POMC Ric-KO, AgRP Ric-KO and control mice at 8 and 22 weeks of age. (F) Random fed and 24-h fasting blood glucose levels of mice of the indicated genotypes are shown. (G) Glucose tolerance tests were performed in 18-week-old POMC Ric-KO (gray squares), AgRP Ric-KO (black squares) and control mice (open circles). (H) Quantitation of area under the glucose curve (AUC) analysis from glucose tolerance testing is illustrated. Values represent the mean±SEM of 4–8 animals of each genotype. (A–E) The a indicates p<0.05 vs. control and b indicates p<0.05 vs. NRic-KO. (F–H) ∗ indicates p<0.05 vs. control.
Figure 8
Figure 8
Assessment of energy balance parameters in POMC Ric-KO mice. Fifty-week-old POMC Ric-KO and control mice were monitored for 48 h using Oxymax/CLAMS cages to assess the (A) respiratory exchange ratio (RER) (VCO2/VO2) during the light and dark periods and (B) daily energy expenditure during calorimetry in mice of the indicated genotypes. (C) Food intake of fed and after 24 h of fasting in 50-week-old mice of the indicated genotypes was measured over 24 h. (D) Percentage of total body weight and fat mass lost following a 24-h fast in 50-week-old mice of the indicated genotypes. Values represent the mean±SEM of 4–6 animals per genotype. ∗ p<0.05 vs. control.

References

    1. Weber J.D., Gutmann D.H. Deconvoluting mTOR biology. Cell Cycle. 2012;11:236–248. - PMC - PubMed
    1. Sengupta S., Peterson T.R., Sabatini D.M. Regulation of the mTOR complex 1 pathway by nutrients, growth factors, and stress. Molecular Cell. 2010;40:310–322. - PMC - PubMed
    1. Oh W.J., Jacinto E. mTOR complex 2 signaling and functions. Cell Cycle. 2011;10:2305–2316. - PMC - PubMed
    1. Bae S.S., Cho H., Mu J., Birnbaum M.J. Isoform-specific regulation of insulin-dependent glucose uptake by Akt/protein kinase B. Journal of Biological Chemistry. 2003;278:49530–49536. - PubMed
    1. Kumar A., Harris T.E., Keller S.R., Choi K.M., Magnuson M.A. Muscle-specific deletion of rictor impairs insulin-stimulated glucose transport and enhances Basal glycogen synthase activity. Molecular and Cellular Biology. 2008;28:61–70. - PMC - PubMed