

Mitochondrial dysfunction has divergent, cell type-dependent effects on insulin action
- PMID: 24944900
- PMCID: PMC4060359
- DOI: 10.1016/j.molmet.2014.02.001
Mitochondrial dysfunction has divergent, cell type-dependent effects on insulin action
Abstract
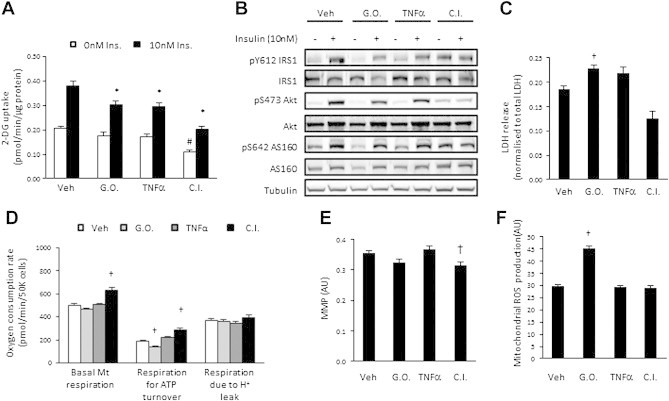
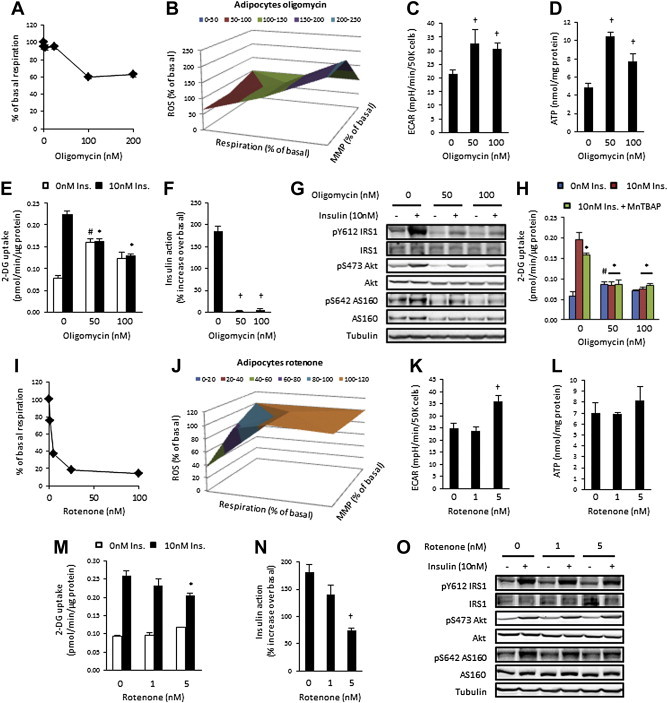
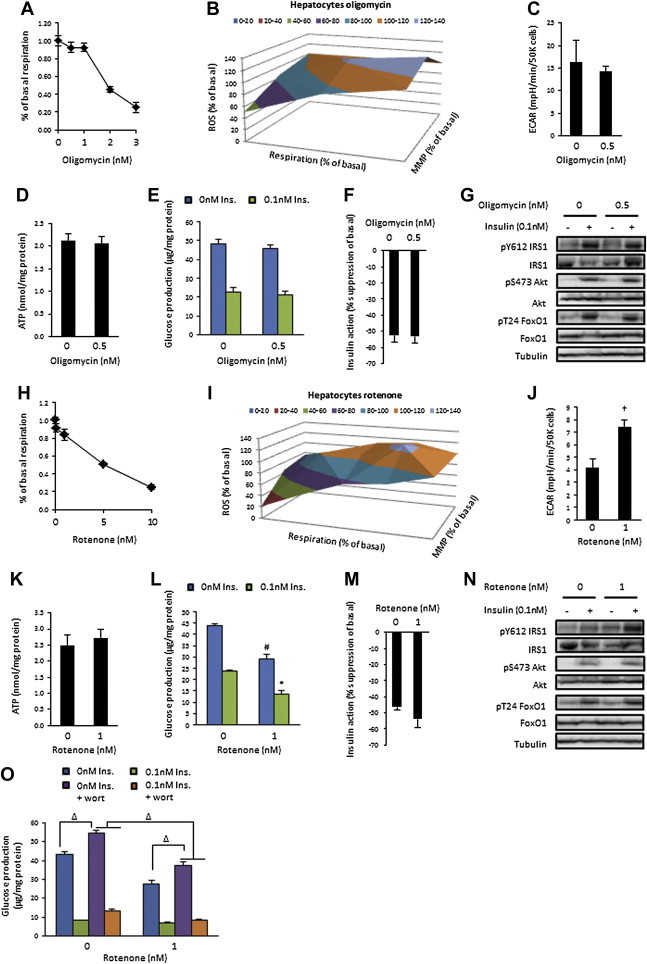
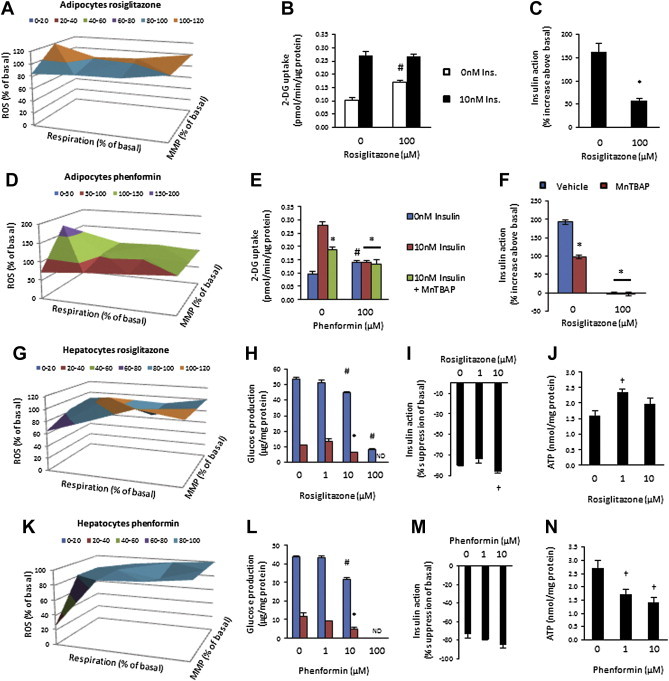
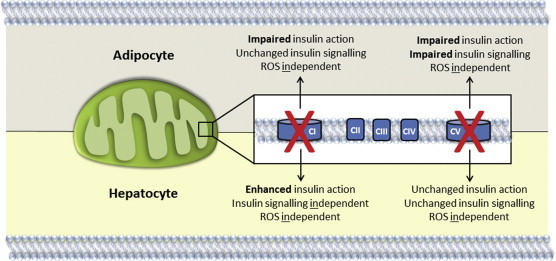
The contribution of mitochondrial dysfunction to insulin resistance is a contentious issue in metabolic research. Recent evidence implicates mitochondrial dysfunction as contributing to multiple forms of insulin resistance. However, some models of mitochondrial dysfunction fail to induce insulin resistance, suggesting greater complexity describes mitochondrial regulation of insulin action. We report that mitochondrial dysfunction is not necessary for cellular models of insulin resistance. However, impairment of mitochondrial function is sufficient for insulin resistance in a cell type-dependent manner, with impaired mitochondrial function inducing insulin resistance in adipocytes, but having no effect, or insulin sensitising effects in hepatocytes. The mechanism of mitochondrial impairment was important in determining the impact on insulin action, but was independent of mitochondrial ROS production. These data can account for opposing findings on this issue and highlight the complexity of mitochondrial regulation of cell type-specific insulin action, which is not described by current reductionist paradigms.
Keywords: AMPK, AMP-activated protein kinase; AS160, Akt substrate of 160 kDa; Adipocyte; BSA, bovine serum albumin; ECAR, extracellular acidification rate; FoxO1, forkhead box protein O1; G.O., glucose oxidase; GLUT4, facilitative glucose transporter isoform 4; GP, glucose production; HI-FBS, heat-inactivated foetal bovine serum; Hepatocyte; IRS1, insulin receptor substrate 1; Insulin action; LDH, lactate dehydrogenase; MMP, mitochondrial membrane potential; Mitochondria; MnTBAP, manganese (III) tetrakis (4-benzoic acid) porphyrin chloride; PI3K, phosphatidylinositol 3-kinase; ROS, reactive oxygen species; Reactive oxygen species; SOD, superoxide dismutase; T2D, type 2 diabetes; TNFα, tumour necrosis factor alpha.
Figures
Similar articles
-
Systems-wide Experimental and Modeling Analysis of Insulin Signaling through Forkhead Box Protein O1 (FOXO1) in Human Adipocytes, Normally and in Type 2 Diabetes.J Biol Chem. 2016 Jul 22;291(30):15806-19. doi: 10.1074/jbc.M116.715763. Epub 2016 May 20. J Biol Chem. 2016. PMID: 27226562 Free PMC article.
-
Thyroid hormone (T3) stimulates brown adipose tissue activation via mitochondrial biogenesis and MTOR-mediated mitophagy.Autophagy. 2019 Jan;15(1):131-150. doi: 10.1080/15548627.2018.1511263. Epub 2018 Sep 13. Autophagy. 2019. PMID: 30209975 Free PMC article.
-
Mitochondrial dysfunction leads to impairment of insulin sensitivity and adiponectin secretion in adipocytes.FEBS J. 2013 Feb;280(4):1039-50. doi: 10.1111/febs.12096. Epub 2013 Jan 27. FEBS J. 2013. PMID: 23253816
-
Recent advances in understanding the anti-diabetic actions of dietary flavonoids.J Nutr Biochem. 2013 Nov;24(11):1777-89. doi: 10.1016/j.jnutbio.2013.06.003. Epub 2013 Sep 9. J Nutr Biochem. 2013. PMID: 24029069 Free PMC article. Review.
-
Regulation of energy metabolism by long-chain fatty acids.Prog Lipid Res. 2014 Jan;53:124-44. doi: 10.1016/j.plipres.2013.12.001. Epub 2013 Dec 18. Prog Lipid Res. 2014. PMID: 24362249 Review.
Cited by
-
Role of miR-181c in Diet-induced obesity through regulation of lipid synthesis in liver.PLoS One. 2021 Dec 8;16(12):e0256973. doi: 10.1371/journal.pone.0256973. eCollection 2021. PLoS One. 2021. PMID: 34879063 Free PMC article.
-
Unraveling biochemical pathways affected by mitochondrial dysfunctions using metabolomic approaches.Metabolites. 2014 Sep 25;4(3):831-78. doi: 10.3390/metabo4030831. Metabolites. 2014. PMID: 25257998 Free PMC article. Review.
-
Whole body and hematopoietic cell-specific deletion of G-protein coupled receptor 65 (GPR65) improves insulin sensitivity in diet-induced obese mice.Mol Metab. 2025 Jul;97:102169. doi: 10.1016/j.molmet.2025.102169. Epub 2025 May 17. Mol Metab. 2025. PMID: 40389090 Free PMC article.
-
Amyloid beta 42 alters cardiac metabolism and impairs cardiac function in male mice with obesity.Nat Commun. 2024 Jan 15;15(1):258. doi: 10.1038/s41467-023-44520-4. Nat Commun. 2024. PMID: 38225272 Free PMC article.
-
Mitochondrial oxidative stress causes insulin resistance without disrupting oxidative phosphorylation.J Biol Chem. 2018 May 11;293(19):7315-7328. doi: 10.1074/jbc.RA117.001254. Epub 2018 Mar 29. J Biol Chem. 2018. PMID: 29599292 Free PMC article.
References
-
- Johnson D.A., Olefsky J.M. Origins and drivers of insulin resistance. Cell. 2013;152:673–684. - PubMed
-
- Kelley D.E., He J., Menshikova E.V., Ritov V.B. Dysfunction of mitochondria in human skeletal muscle in type 2 diabetes. Diabetes. 2002;51:2944–2950. - PubMed
-
- Ritov V.B., Menshikova E.V., He J., Ferrell R.E., Goodpaster B.H., Kelley D.E. Deficiency of subsarcolemmal mitochondria in obesity and type 2 diabetes. Diabetes. 2005;54:8–14. - PubMed
LinkOut - more resources
Full Text Sources
Other Literature Sources
Research Materials
Miscellaneous
