Review
. 2014 May;3(2):97-107.
doi: 10.1159/000343865.

Diagnosis of Pathologically Early HCC with EOB-MRI: Experiences and Current Consensus

Affiliations
Review

Diagnosis of Pathologically Early HCC with EOB-MRI: Experiences and Current Consensus

Tomoaki Ichikawa et al. Liver Cancer. 2014 May.

Abstract

Objective: After much debate, the International Consensus Group for Hepatocellular Neoplasia (ICGHN) has recently arrived at a conclusion regarding the pathological criteria for early hepatocellular carcinoma (HCC). They have stated that stromal invasion should be recognized as the most important pathological finding for precisely diagnosing and differentiating early HCC from dysplastic nodules (DN).

Methods: We conducted a review of the imaging findings from multi-imaging modalities of early HCC cases diagnosed according to the pathological criteria of the ICGHN. The multi-imaging modalities included gadoxetic acid (Gd-EOB-DTPA) enhanced magnetic resonance imaging (MRI), abbreviated as EOB-MRI, contrast-enhanced CT (CE-CT), CT during arterioportography (CTAP), and CT during hepatic arteriography (CTHA). It has been shown that EOB-MRI is the only imaging modality that has sufficient resolution for the detection and classification of early HCC.

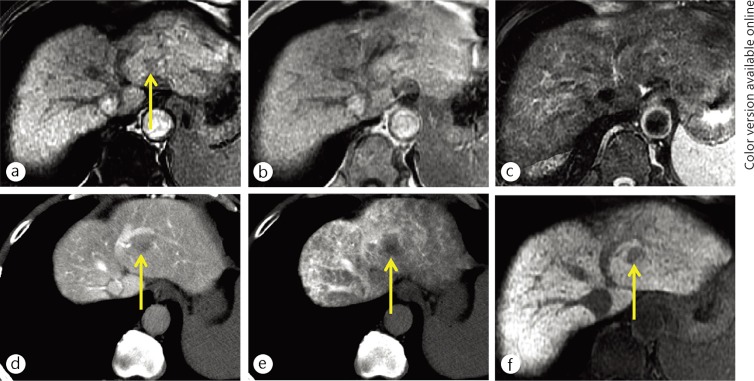
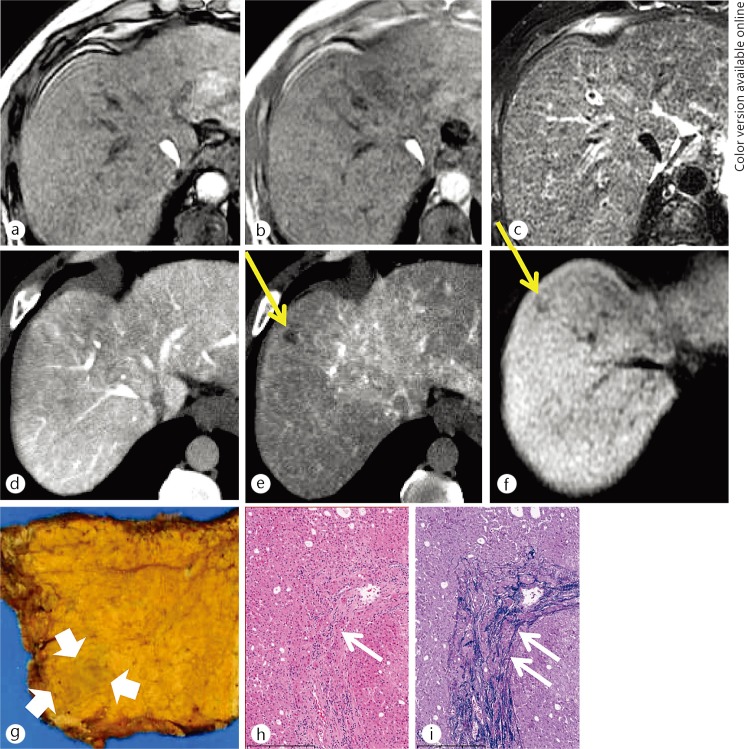
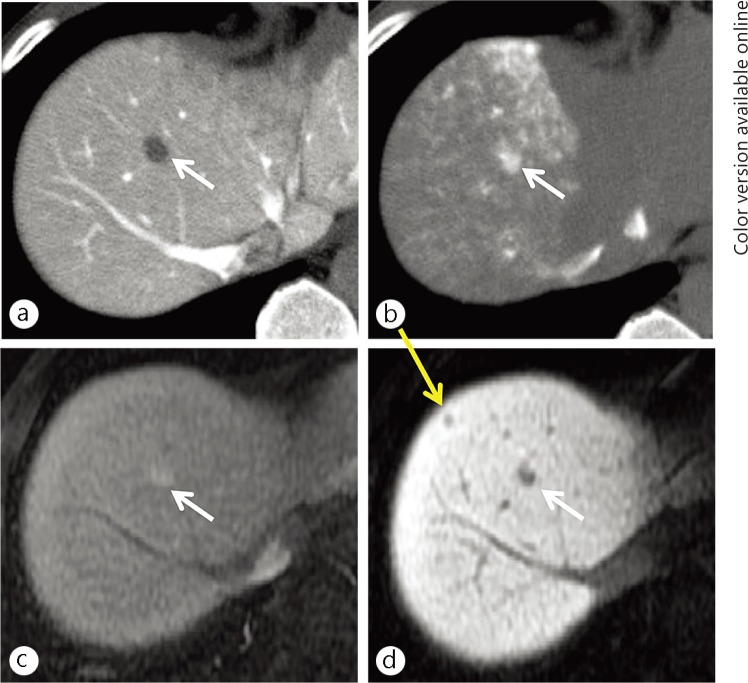
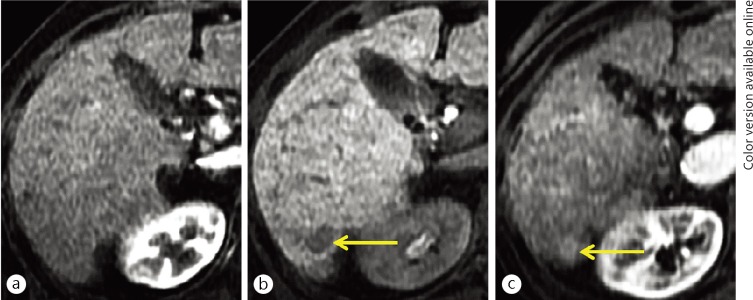
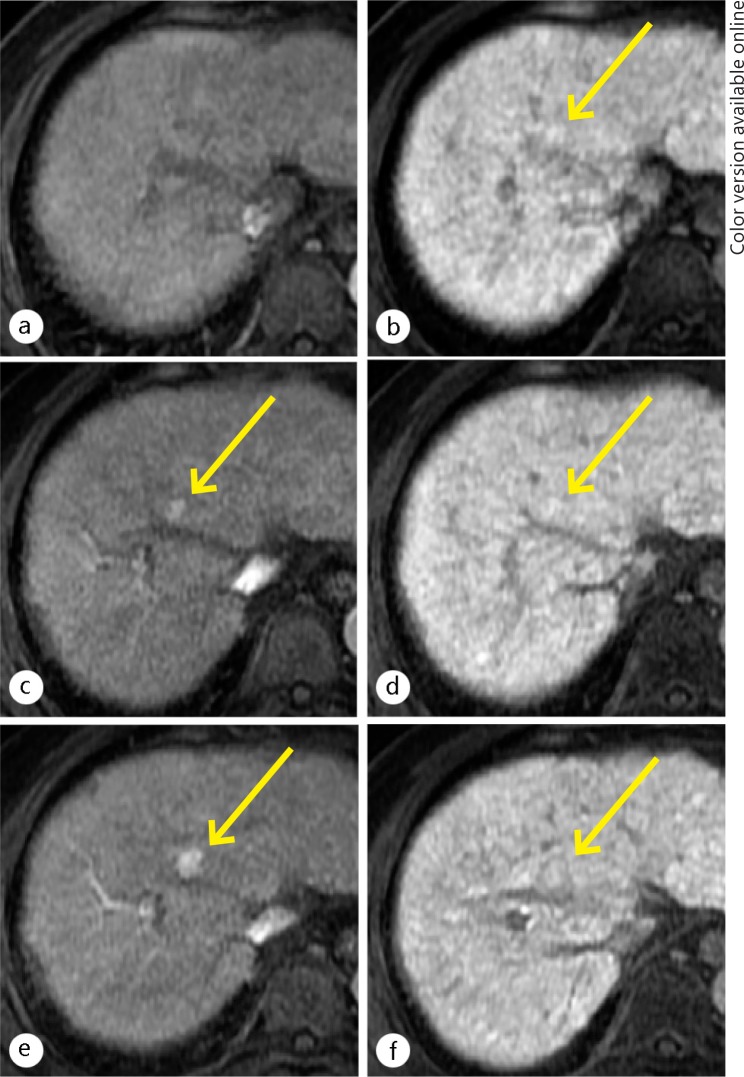
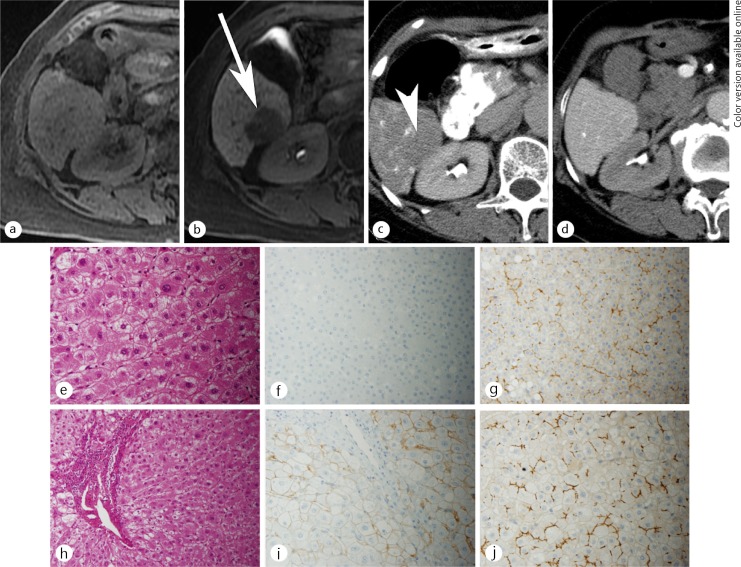
Results: The most significant imaging feature for diagnosing early HCC was hypointensity on hepatobiliary-phase (HP) images of EOB-MRI; all of the cases of early HCC that were detected on HP images of EOB-MRI showed hypointensity, while all of the images of DN showed isointensity or hyperintensity compared with the liver parenchyma. The results of the diagnostic performance analysis showed that EOB-MRI had excellent sensitivity (97%) for detecting early HCC and outstanding specificity (100%) for distinguishing early HCC from DN.

Conclusions: Considering the results from imaging-pathologic correlations and follow-up studies indicating that many early-stage hepatocellular nodules showing hypointensity on HP images of EOB-MRI tend to develop hypervascularization during a relatively short follow-up period, it is beginning to be accepted that such nodules may be treated as early HCC. However, hepatologists and radiologists should also recognize that some cases of early HCC may show isointensity or hyperintensity on HP images of EOB-MRI, making it impossible to differentiate early HCC from DN, although the low prevalence of such nodules may be unlikely to affect the generally accepted follow-up protocols for cirrhotic patients. Our results and other recent reports have indicated that signal-intensity patterns on HP images of EOB-MRI for DN and early HCC directly correlate with the degree of expression of the organic anion transporting polypeptide (OATP) 1B3 in the nodules. Thus, the diagnostic performance of pathological analyses for early HCC cases may be dramatically improved, nearly up to that of EOB-MRI, by incorporating an OATP1B3 staining method.

Keywords: Early hepatocellular carcinoma; Gadoxetic acid; MRI; OATP1B3.


Figures

Fig. 1
Fig. 1
A 65-year-old man with early HCC (yellow arrows). The nodule was demonstrated as a hypointensity on opposed-phase T1-weighted MR imaging (a). There was no nodule on in-phase T1-weighted (b) and T2-weighted (c) MR images. The nodule was identified as slight hypoattenuation on CT during arterioportography (d) because the nodule showed slightly decreased portal flow compared with surrounding liver parenchyma. The nodule also showed slightly decreased arterial flow on CT during hepatic arteriography (e). The nodule was clearly demonstrated as exhibiting hypointensity on hepatocyte imaging of EOB-MRI (f).
Fig. 2
Fig. 2
A 50-year-old man with an early HCC. There was no nodule on the opposed-phase (a), the inphase (b) T1-weighted MR images or the T2-weighted MR image (c). There was no nodule on CT image during arterioportography (d) because the nodule showed equivalent portal flow compared with the surrounding liver parenchyma. The nodule (yellow arrows) showed decreased arterial flow on CT imaging during hepatic arteriography (e). The nodule was detected as hypointense on hepatocyte imaging via EOB-MRI (f). On histological examination, this nodule was identified as a small nodule with an unclear margin (thick white arrows) macroscopically (g). Portal invasion (white short arrows), which is a unique finding to early HCC, was identified on hematoxylin and eosin staining (h) and Victoria-blue staining (i), respectively.
Fig. 3
Fig. 3
A 58-year-old man with a conventional (hypervascular) HCC (white arrows) and an early HCC (yellow arrow). A small nodule was demonstrated as hypoattenuation (lack of portal flow) on CT imaging during arterioportography (a) and hyperattenuation (increased arterial flow) on CT imaging during hepatic arteriography (b). These findings are typical for a conventional (hypervascular) HCC. No additional nodule was not seen on these images. The conventional HCC showed hypervascularity on the hepatic arterial-dominant phase image (c) and hypointensity on the hepatocyte imaging (d) of the EOB-MRI. On hepatocyte imaging alone, a small hypointense nodule was demonstrated. The nodule was finally proven to be an early HCC based on surgicopathological examination.
Fig. 4
Fig. 4
An 81-year-old woman with a hypovascular, hypointense nodule on hepatocyte imaging of EOB-MRI (yellow arrows). A nodule of 12-mm in size was demonstrated showing hypovascularity (lack of arterial flow) on hepatic arterial-dominant phase imaging (a) and hypointensity on hepatocyte imaging (b) on the initial EOB-MRI examination. These findings are typical for an early (hypovascular) HCC. On follow-up hepatic arterial-dominant phase imaging of EOB-MRI (c), obtained three years after the initial EOB-MRI examination, early contrast-enhancement appeared within the nodule.
Fig. 5
Fig. 5
A 57-year-old man with a hypovascular, hyperintense nodule on hepatocyte imaging of EOB-MRI (yellow arrows) (a, b). A nodule of 8-mm in size was demonstrated as slight hyperintensity on hepatocyte imaging (b) of the initial EOB-MRI examination. At this time, the nodule was not identified on the hepatic arterial-dominant phase imaging (a) because it did not show hypervascularity. On follow-up images of an EOB-MRI obtained 12 months after the initial examination, the nodule showed hypervascularity on hepatic arterial-dominant phase imaging (c). The nodule remained slightly hyperintense on hepatocyte imaging (d). On follow-up images of EOB-MRI obtained 17 months after the initial examination, the nodule with hypervascularity increased in size on hepatic arterial-dominant phase imaging (e) and hepatocyte imaging (f). The nodule showed no interval change of the high signal intensity on hepatocyte imaging (f).
Fig. 6
Fig. 6
A 58-year-old man with an early HCC. No lesion was shown on the unenhanced T1WI (a). Hepatocyte phase imaging (b) showed a well-defined nodule at the posterior segment of the right lobe of the liver (arrow). The nodule showed decreased uptake of gadexetic acid (relative enhancement ratio of 0.52), resulting in hypointensity relative to the surrounding liver. This nodule showed a slight decrease of arterial flow on CT imaging during hepatic arteriography (c), and equivalent of portal venous flow during arterioportography (d) compared to the surrounding liver. The histological examination of the nodule (e-g) compared with the surrounding liver (h-j), showed slight cellular atypia and mild increased cell density with thick trabecular pattern on hematoxylin and eosin stain (e), no expression of OATP1B3 (f), and equivalent expression of MRP2 (g) compared with surrounding liver (h, i, j, respectively).

References

    1. Kudo M. Early hepatocellular carcinoma: definition and diagnosis. Liver Cancer. 2013;2:69–72. - PMC - PubMed
    1. Kudo M. Multistep human hepatocarcinogenesis: correlation of imaging with pathology. J Gastroenterol. 2009;44(Suppl 19):112–118. - PubMed
    1. Kitao A, Zen Y, Matsui O, Gabata T, Nakanuma Y. Hepatocarcinogenesis: multistep changes of drainage vessels at CT during arterial portography and hepatic arteriography—radiologic-pathologic correlation. Radiology. 2009;252:605–614. - PubMed
    1. Sakamoto M, Hirohashi S, Shimosato Y. Early stages of multistep hepatocarcinogenesis: adenomatous hyperplasia and early hepatocellular carcinoma. Hum Pathol. 1991;22:172–178. - PubMed
    1. International Working Party Terminology of nodular hepatocellular lesions. Hepatology. 1995;22:983–993. - PubMed