

A digital framework to build, visualize and analyze a gene expression atlas with cellular resolution in zebrafish early embryogenesis
- PMID: 24945246
- PMCID: PMC4063669
- DOI: 10.1371/journal.pcbi.1003670
A digital framework to build, visualize and analyze a gene expression atlas with cellular resolution in zebrafish early embryogenesis
Abstract
A gene expression atlas is an essential resource to quantify and understand the multiscale processes of embryogenesis in time and space. The automated reconstruction of a prototypic 4D atlas for vertebrate early embryos, using multicolor fluorescence in situ hybridization with nuclear counterstain, requires dedicated computational strategies. To this goal, we designed an original methodological framework implemented in a software tool called Match-IT. With only minimal human supervision, our system is able to gather gene expression patterns observed in different analyzed embryos with phenotypic variability and map them onto a series of common 3D templates over time, creating a 4D atlas. This framework was used to construct an atlas composed of 6 gene expression templates from a cohort of zebrafish early embryos spanning 6 developmental stages from 4 to 6.3 hpf (hours post fertilization). They included 53 specimens, 181,415 detected cell nuclei and the segmentation of 98 gene expression patterns observed in 3D for 9 different genes. In addition, an interactive visualization software, Atlas-IT, was developed to inspect, supervise and analyze the atlas. Match-IT and Atlas-IT, including user manuals, representative datasets and video tutorials, are publicly and freely available online. We also propose computational methods and tools for the quantitative assessment of the gene expression templates at the cellular scale, with the identification, visualization and analysis of coexpression patterns, synexpression groups and their dynamics through developmental stages.
Conflict of interest statement
The authors have declared that no competing interests exist.
Figures

 ,
,  and
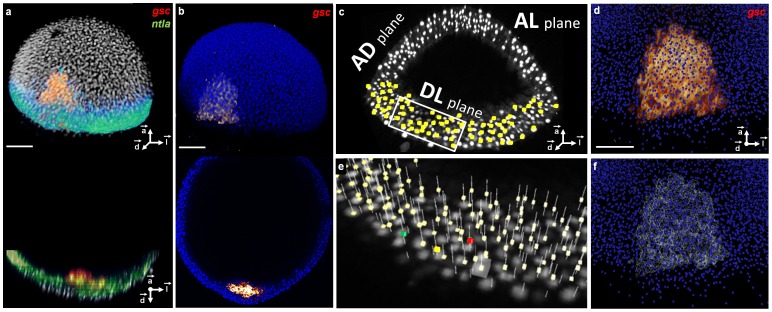
and  planes. (d) Zoom on the template gsc raw expression (red) superimposed on the template nuclear positions (blue). (e) 3× zoom on the boxed region in (c) with detected nuclei positions (pale yellow), an example of a validated nucleus (green), a false positive (red), a false negative (yellow) and a selected position to be evaluated (white cube). (f) Same as (d) with the segmented gsc domain (white). Scale bars,
  m. Axes point to the animal pole (
 ), dorsal side (
 ) and lateral side (
 ) of the embryo respectively.
 . (b) Same with the template, detected nuclei in blue. (c) Initialization step aligning the
  basis of the analyzed embryo and the template; the yellow arrowhead points to a mismatch refined in (d) through the registration procedure. Scale bar
  m.
m.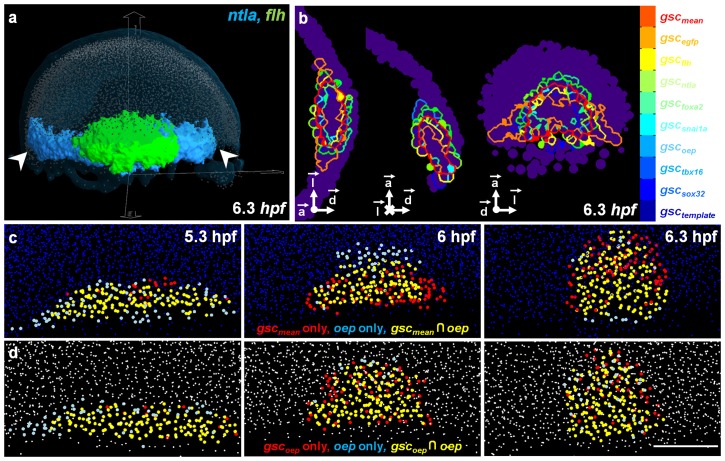
 pair over time after being mapped onto the template. (d) Evolution of the oep-gsc
 pair over time in the analyzed embryo where they were co-stained. Scale bar
  m.
m.
 m.
m.References
-
- Schier A, Talbot W (2005) Molecular genetics of axis formation in zebrafish. Annu Rev Genet 39: 561–613. - PubMed
-
- Oates A, Gorfinkiel N, González-Gaitán M, Heisenberg C (2009) Quantitative approaches in developmental biology. Nature Reviews Genetics 10: 517–530. - PubMed
-
- Megason S, Fraser S (2007) Imaging in systems biology. Cell 130: 784–795. - PubMed
-
- Abbott A (2009) Microscopic marvels: Seeing the system. Nature 459: 630. - PubMed
Publication types
MeSH terms
LinkOut - more resources
Full Text Sources
Other Literature Sources
Molecular Biology Databases
