. 2014 Jul;9(7):1682-97.
doi: 10.1038/nprot.2014.123. Epub 2014 Jun 19.

Advanced CLARITY for rapid and high-resolution imaging of intact tissues

Affiliations

Advanced CLARITY for rapid and high-resolution imaging of intact tissues

Raju Tomer et al. Nat Protoc. 2014 Jul.

Abstract

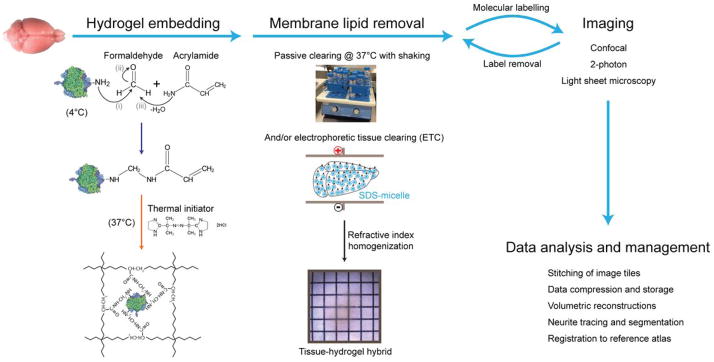
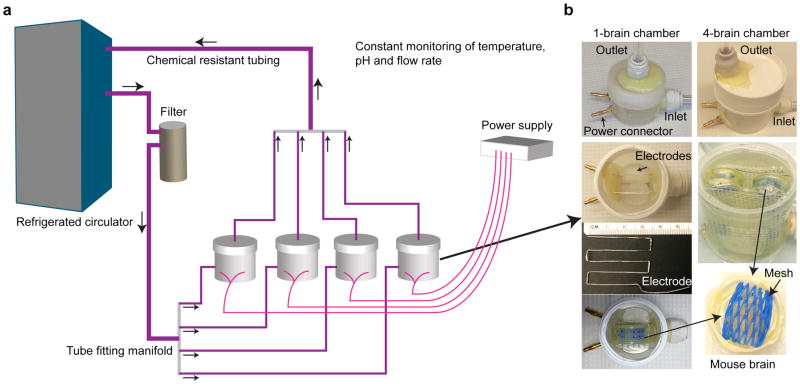
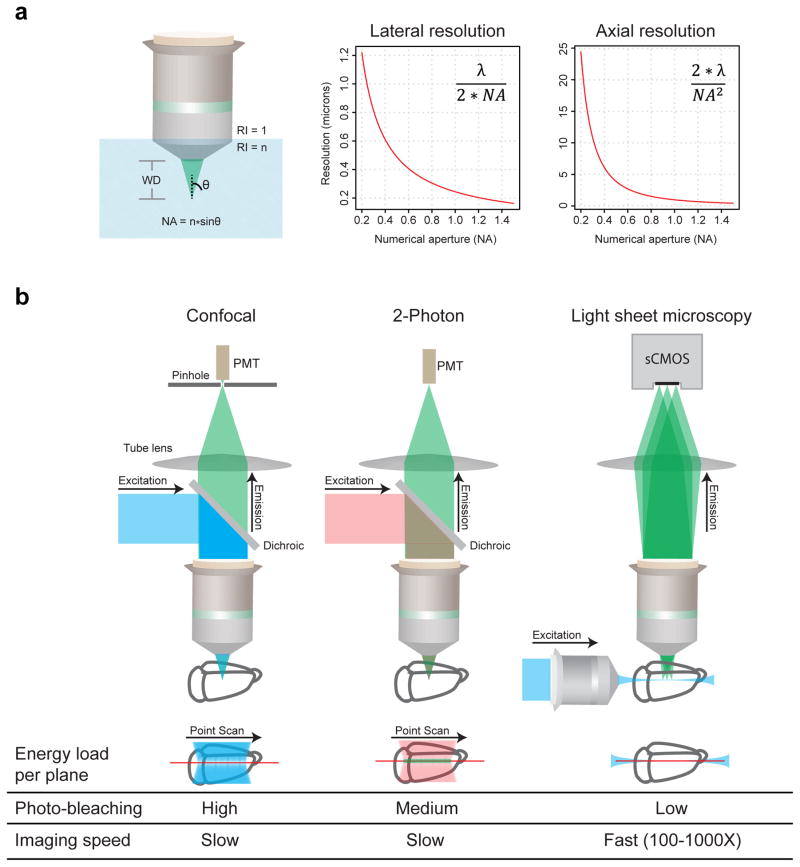
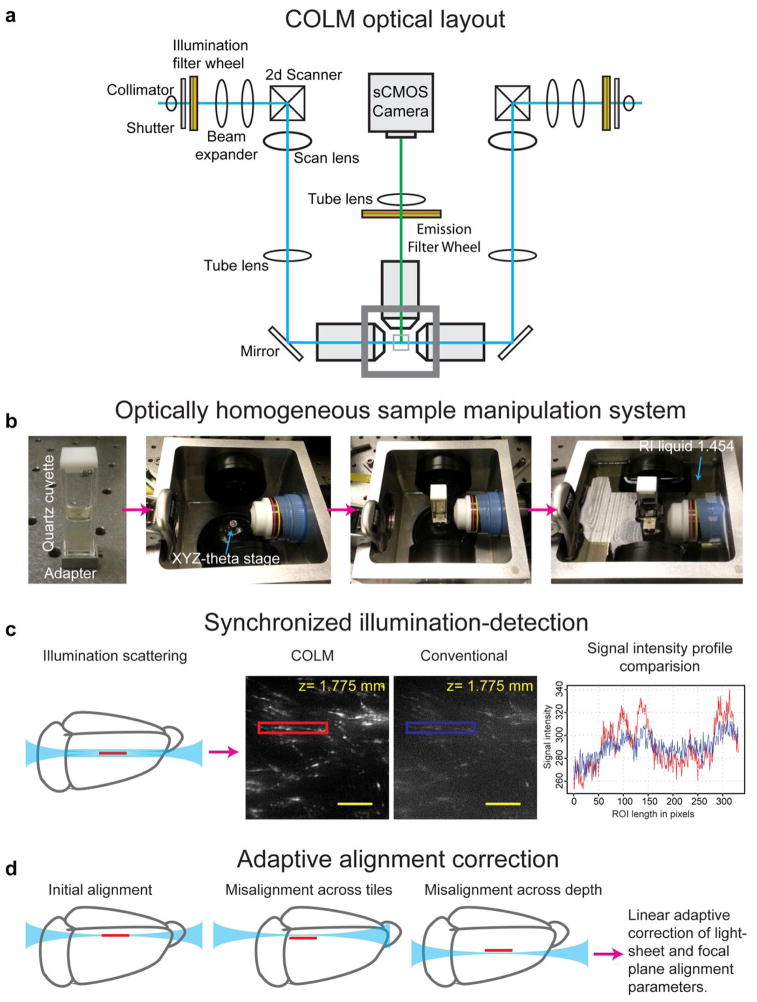
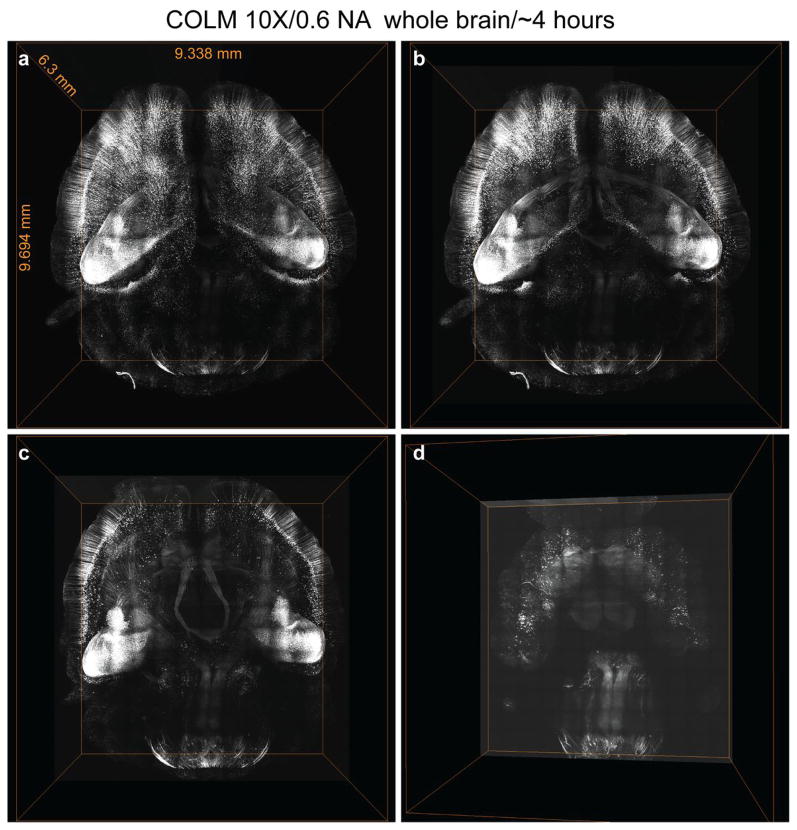
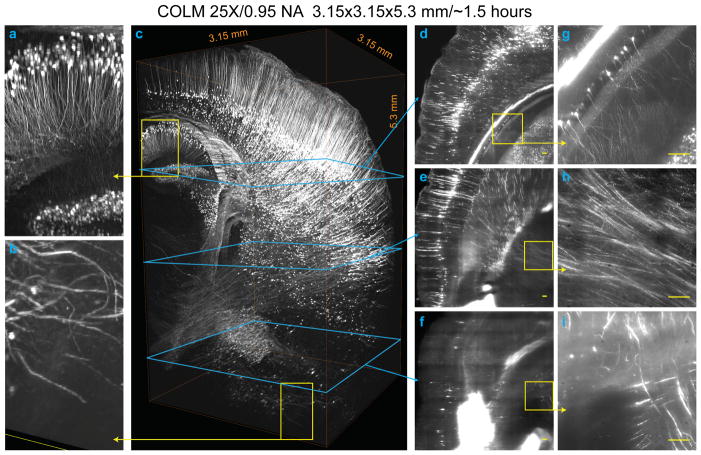
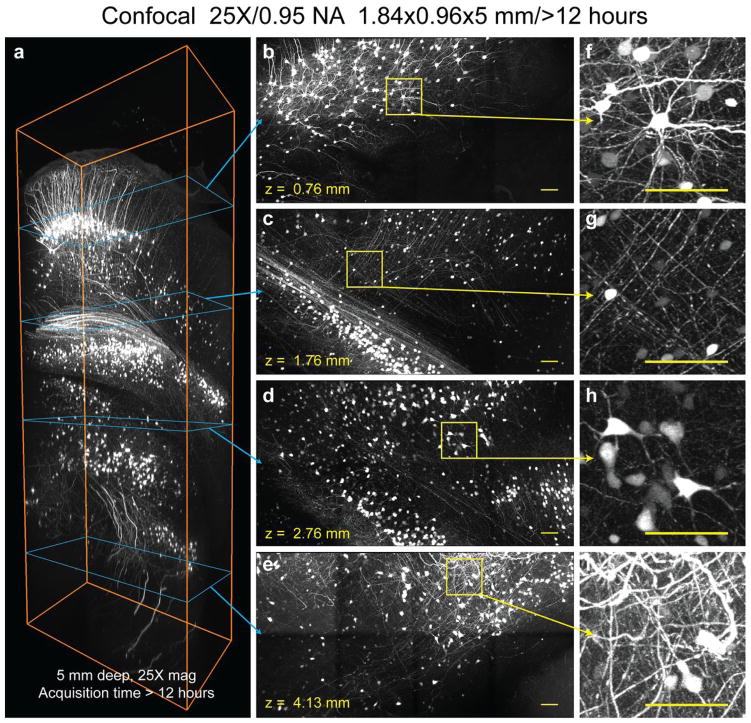
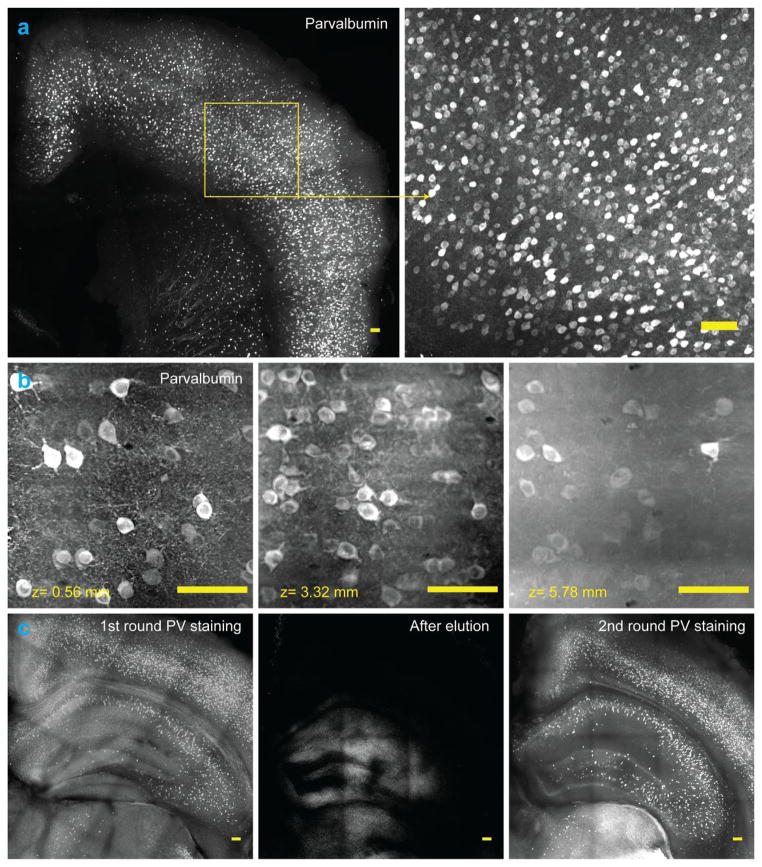
CLARITY is a method for chemical transformation of intact biological tissues into a hydrogel-tissue hybrid, which becomes amenable to interrogation with light and macromolecular labels while retaining fine structure and native biological molecules. This emerging accessibility of information from large intact samples has created both new opportunities and new challenges. Here we describe protocols spanning multiple dimensions of the CLARITY workflow, ranging from simple, reliable and efficient lipid removal without electrophoretic instrumentation (passive CLARITY) to optimized objectives and integration with light-sheet optics (CLARITY-optimized light-sheet microscopy (COLM)) for accelerating data collection from clarified samples by several orders of magnitude while maintaining or increasing quality and resolution. The entire protocol takes from 7-28 d to complete for an adult mouse brain, including hydrogel embedding, full lipid removal, whole-brain antibody staining (which, if needed, accounts for 7-10 of the days), and whole-brain high-resolution imaging; timing within this window depends on the choice of lipid removal options, on the size of the tissue, and on the number and type of immunostaining rounds performed. This protocol has been successfully applied to the study of adult mouse, adult zebrafish and adult human brains, and it may find many other applications in the structural and molecular analysis of large assembled biological systems.


Conflict of interest statement

Competing Interests Statement: None.

Figures

Figure 1
Figure 1. CLARITY pipeline overview
The tissue sample, e.g. an intact mouse brain, is perfused with cold hydrogel monomer solution that contains a cocktail of acrylamide, bisacrylamide, formaldehyde and thermal initiator. Formaldehyde mediates crosslinking of biomolecules to acrylamide monomers via amine groups; presumptive chemistry of this process is shown. Hydrogel polymerization is initiated by incubating the perfused tissue at 37°C, resulting in a meshwork of fibers that preserves biomolecules and structural integrity of the tissue. Lipid membranes are removed by passive thermal clearing in SBC solution at 37°C or by electrophoretic tissue clearing (ETC). The resulting intact tissue-hydrogel hybrid can undergo multiple rounds of molecular and structural interrogation using immunohistochemistry and light microscopy. A dedicated computational infrastructure is needed to analyze and store the data. All animal experiments were carried out with Stanford University Institutional review panel approval.
Figure 2
Figure 2. Electrophoretic tissue clearing
(a) Schematic of a multiplexed electrophoretic tissue clearing setup. (b) Implementation of two differently-sized ETC chambers fitting one brain (left) or up to four brains (right). Top pair of images: the two chambers are constructed similarly with regard to power and fluid inlet/outlet. Second image at left: internal arrangement of electrodes. Third image at left: dimension of electrode geometry: note centimeter-ruler for scale. Fourth image at left: positioning of a brain in the single-brain chamber. Second image at right: positioning of 4 brains in the multi-brain chamber. Third image at right: closeup of non-metallic mesh for brain positioning: similar composition and positioning for both chambers.
Figure 3
Figure 3. Imaging clarified samples
(a) Key microscope objective parameters relevant to CLARITY are working distance (WD), numerical aperture (NA), refractive index (n), and multi-color correction. Working distance is the distance between the objective lens and the focal plane. Numerical aperture (NA) relates to the fraction of total emitted signal collected by an objective, and higher NA enables higher resolution. The graphs plot diffraction-limited lateral and axial resolution parameters as a function of NA, assuming λ=500 nm. (b) Comparison of confocal, two-photon and light sheet microscopy. Confocal achieves optical sectioning by employing a pinhole in front of the photomultiplier tubes (PMTs). Two-photon utilizes the fact that only simultaneous absorption of two photons (of longer wavelengths) results in fluorescence signal emission, an event more likely to occur at the point of highest light intensity in the sample i.e. the focal plane. Light sheet fluorescence microscopy achieves optical sectioning by selectively confining the illumination to the plane of interest. Confocal and two-photon are point scanning and hence inherently slow, whereas light sheet microscopy uses fast sCMOS/CCD cameras to image the selectively illuminated focal plane, resulting in 2 to 3 orders of magnitude faster imaging speed and minimal photo-bleaching.
Figure 4
Figure 4. CLARITY optimized light-sheet microscopy (COLM) for large intact samples
(a) Optical layout of the CLARITY optimized light-sheet microscope. Two light sheets are created from opposite sides; shown are galvanometer scanners, scan lens, tube lens and illumination objectives. The emitted fluorescence is imaged with an in-focus detection objective, tube lens and sCMOS camera. Illumination and emission filter wheels (motorized) are used to generate well-defined excitation light and emission signal bands respectively. The innovations required for COLM are discussed in b–d, and schematic shown in Supplemental Figure 2. (b) Optically homogeneous sample mounting framework for large intact samples. Clarified samples, such as intact adult mouse brain, are mounted in a quartz cuvette filled with refractive index matching solution such as FocusClear. Note that the refractive index of quartz glass (~1.458) is nearly identical to that of FocusClear (~1.454). A bottom-adapter is used to attach the cuvette to the xyz-theta stage in the sample chamber, which is then filled with a matching refractive index liquid (~1.454). This results in an optically homogenous sample manipulation system with minimal refractive-index transition boundaries. (c) Synchronized illumination and detection is achieved by synchronizing the scanning beam with the uni-directional readout of a sCMOS camera chip, resulting a virtual-slit effect that allows substantially improved imaging quality, as illustrated by the images shown acquired from the same plane with COLM and with conventional light-sheet microscopy. The graph at right compares the signal intensity profile of a field acquired with COLM (red) and conventional light-sheet microscopy (blue). (d) Large clarified samples can have significant refractive index inhomogeneity, resulting in the need for correction of misalignment of illumination with the focal plane of the detection objective. We achieve this with a linear adaptive calibration procedure before starting the imaging experiment as described in Step 22B. All scale bars: 100 μm.
Figure 5
Figure 5. Ultrafast imaging of whole mouse brain using COLM
(a) Volume rendering of whole mouse brain dataset acquired from an intact clarified Thy1-eYFP mouse brain using COLM. (b), (c) and (d) illustrate internal details of the intact mouse brain volume visualized by successive removal of occluding dorsal-side images. The brain was perfused with 0.5% acrylamide monomer solution, and clarified passively at 37°C with gentle shaking. Camera exposure time of 20 ms was used, and the refractive index liquid 1.454 was used as immersion media. The entire dataset was acquired in ~4 hours using a 10X, 0.6 NA objective. Video S1 demonstrates visualization of the dataset at high resolution.
Figure 6
Figure 6. Fast high-resolution imaging of clarified brain using COLM
3.15 mm x 3.15 mm x 5.3 mm volume acquired from an intact clarified Thy1-eYFP mouse brain using COLM with 25x magnification; the brain had been perfused with 0.5% acrylamide monomer solution. The complete image dataset was acquired in ~1.5 hours; for optimal contrast the LUT of zoomed-in images was linearly adjusted between panels. (a) and (b) show magnified views from panel (c) region defined by yellow squares. (d)–(i) show maximum-intensity projections of over a 50 micron-thick volume, as shown by the progression of cyan and yellow boxes and arrows. Camera exposure time of 20 ms was used; refractive index liquid 1.454 was used as the immersion medium. High resolution details of the data set are provided in Video S2. All scale bars: 100 μm.
Figure 7
Figure 7. Optimized confocal microscopy of clarified samples
1.837 mm X 0.959 mm X 5 mm volume imaged from an intact cleared Thy1-eYFP mouse brain using a confocal microscope at 25X magnification. Brain was perfused with 4% acrylamide monomer solution. a: Rendering of entire volume. Images were acquired in top to bottom direction, corresponding to dorso-ventral brain axis. b, c, d and e are maximum-intensity Z-projections (1 mm, 1 mm, 1 mm, 1.7 mm thick respectively) at different imaging depths as marked by cyan arrow. f–i: Magnified images of the regions marked by yellow squares in b–e. Video S3 details 3D rendering of the entire volume. Scale bars: 100 μm.
Figure 8
Figure 8. Molecular interrogation of clarified tissue
(a) Parvalbumin (PV) positive neurons in a 1 mm thick tissue block of mouse brain, labeled using anti-PV antibody. The brain was perfused with 4% acrylamide monomer solution. The tissue block was imaged using confocal microscopy. Images represent maximum intensity projections. (b) Whole brain immunostaining to label all PV positive neurons in an intact mouse brain. Panels show labeled cells at different depths in the sample. The brain was perfused with 4% acrylamide monomer solution and clarified passively. The intact brain was imaged using COLM with a 25x objective. (c) Multiple rounds of immunostaining in the same tissue block (1% acrylamide monomer solution). Left-to-right: first round of immunostaining for PV, followed by label elution via overnight (~12 hours) incubation in clearing buffer at 60°C, in turn followed by a second round of immunostaining for PV. DAPI present in the first round was successfully eluted as well (not shown). All images represent maximum Z-projections and all scale bars are 100 μm.

References

    1. Bock DD, et al. Network anatomy and in vivo physiology of visual cortical neurons. Nature. 2011;471:177–182. doi: 10.1038/nature09802. - DOI - PMC - PubMed
    1. Briggman KL, Helmstaedter M, Denk W. Wiring specificity in the direction-selectivity circuit of the retina. Nature. 2011;471:183–188. doi: 10.1038/nature09818. - DOI - PubMed
    1. Conchello JA, Lichtman JW. Optical sectioning microscopy. Nature methods. 2005;2:920–931. doi: 10.1038/nmeth815. - DOI - PubMed
    1. Helmchen F, Denk W. Deep tissue two-photon microscopy. Nature methods. 2005;2:932–940. doi: 10.1038/nmeth818. - DOI - PubMed
    1. Tang J, Germain RN, Cui M. Superpenetration optical microscopy by iterative multiphoton adaptive compensation technique. Proceedings of the National Academy of Sciences of the United States of America. 2012;109:8434–8439. doi: 10.1073/pnas.1119590109. - DOI - PMC - PubMed

Publication types

Substances