

Understanding the sub-cellular dynamics of silicon transportation and synthesis in diatoms using population-level data and computational optimization
- PMID: 24945622
- PMCID: PMC4063665
- DOI: 10.1371/journal.pcbi.1003687
Understanding the sub-cellular dynamics of silicon transportation and synthesis in diatoms using population-level data and computational optimization
Abstract
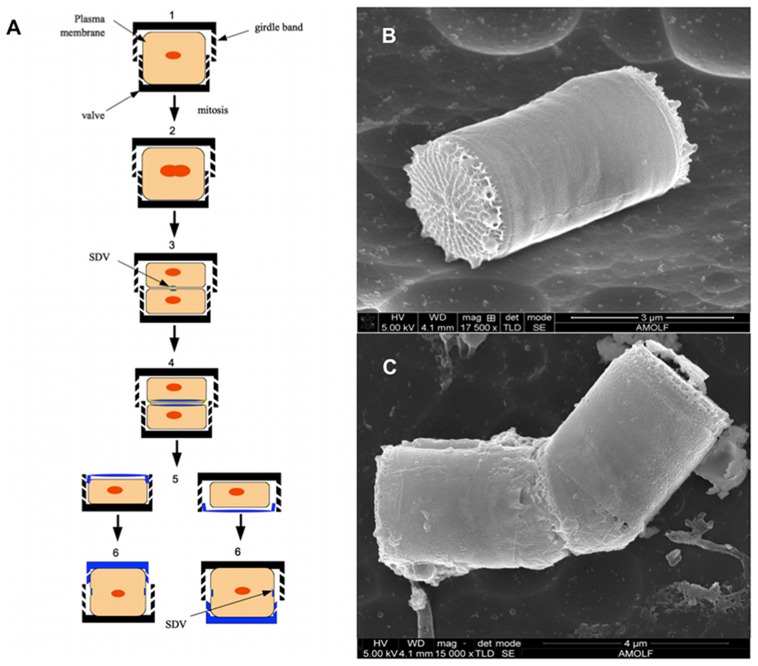
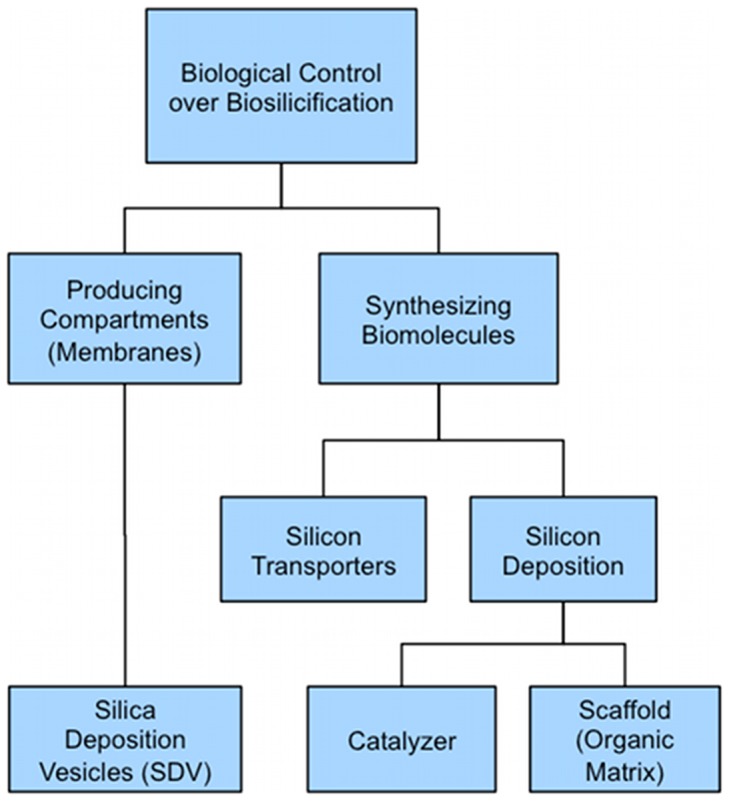
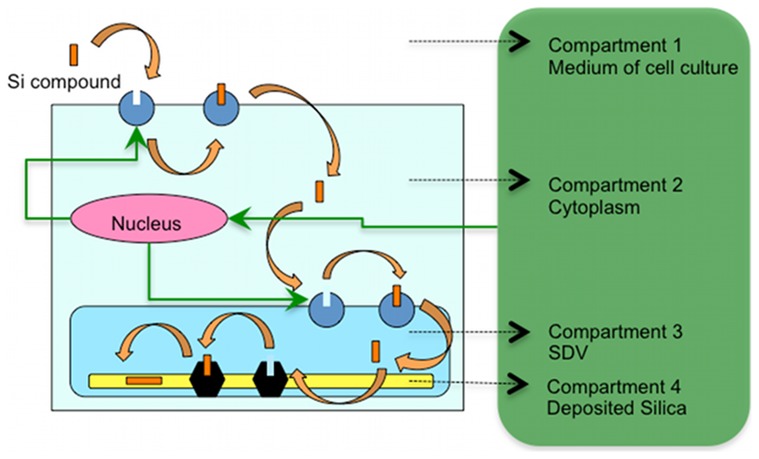
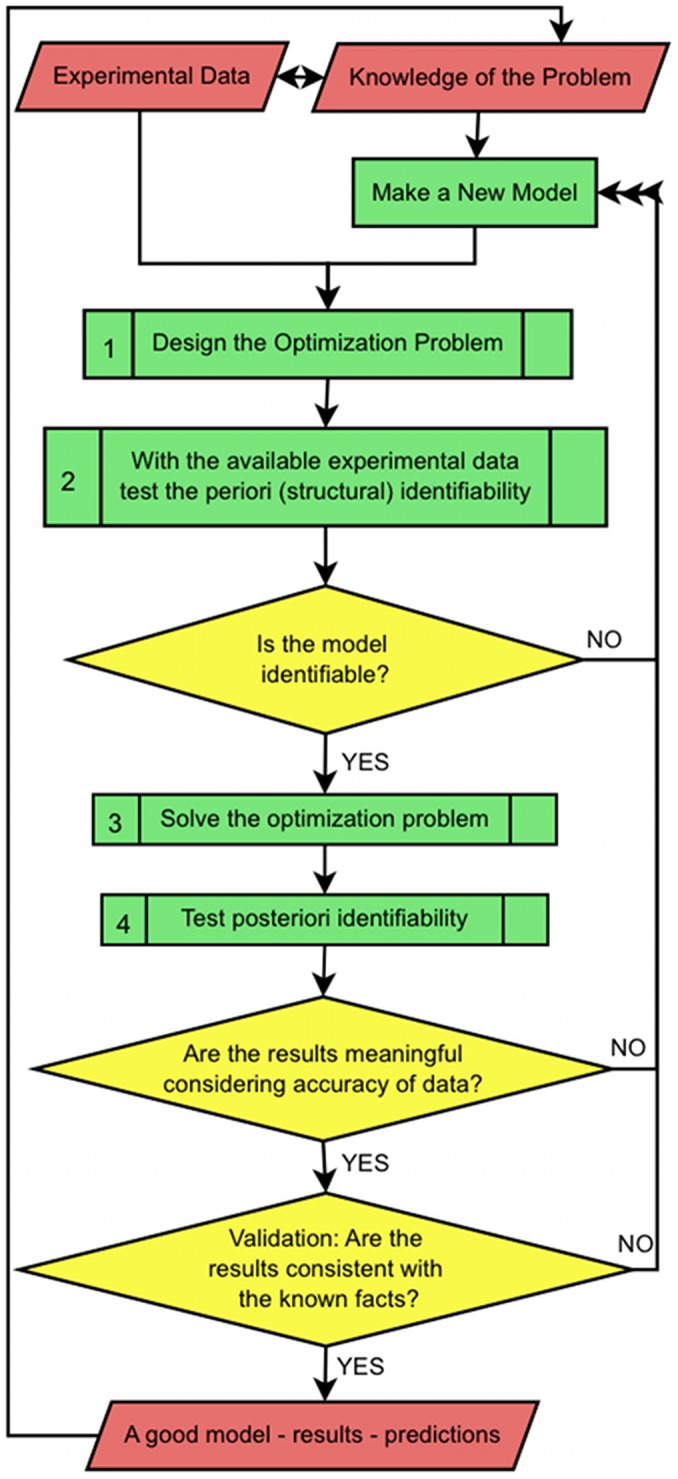
Controlled synthesis of silicon is a major challenge in nanotechnology and material science. Diatoms, the unicellular algae, are an inspiring example of silica biosynthesis, producing complex and delicate nano-structures. This happens in several cell compartments, including cytoplasm and silica deposition vesicle (SDV). Considering the low concentration of silicic acid in oceans, cells have developed silicon transporter proteins (SIT). Moreover, cells change the level of active SITs during one cell cycle, likely as a response to the level of external nutrients and internal deposition rates. Despite this topic being of fundamental interest, the intracellular dynamics of nutrients and cell regulation strategies remain poorly understood. One reason is the difficulties in measurements and manipulation of these mechanisms at such small scales, and even when possible, data often contain large errors. Therefore, using computational techniques seems inevitable. We have constructed a mathematical model for silicon dynamics in the diatom Thalassiosira pseudonana in four compartments: external environment, cytoplasm, SDV and deposited silica. The model builds on mass conservation and Michaelis-Menten kinetics as mass transport equations. In order to find the free parameters of the model from sparse, noisy experimental data, an optimization technique (global and local search), together with enzyme related penalty terms, has been applied. We have connected population-level data to individual-cell-level quantities including the effect of early division of non-synchronized cells. Our model is robust, proven by sensitivity and perturbation analysis, and predicts dynamics of intracellular nutrients and enzymes in different compartments. The model produces different uptake regimes, previously recognized as surge, externally-controlled and internally-controlled uptakes. Finally, we imposed a flux of SITs to the model and compared it with previous classical kinetics. The model introduced can be generalized in order to analyze different biomineralizing organisms and to test different chemical pathways only by switching the system of mass transport equations.
Conflict of interest statement
The authors have declared that no competing interests exist.
Figures
 and
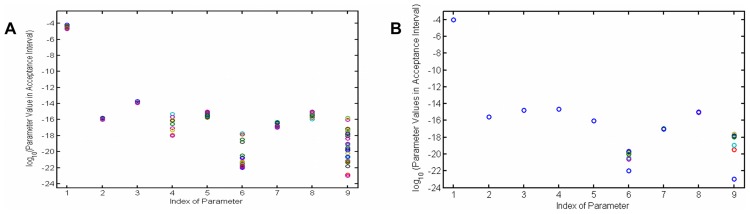
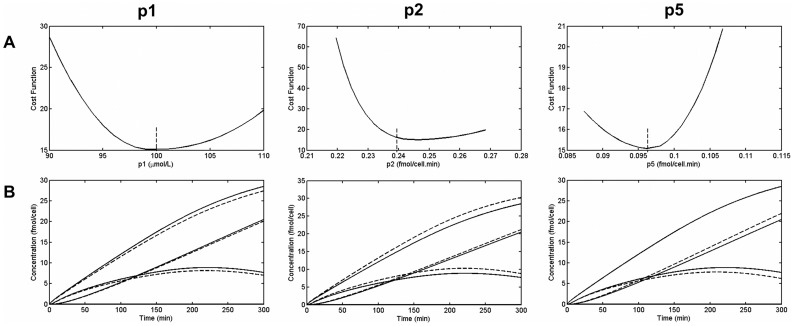
and  , most of the parameter values are not scattered much.
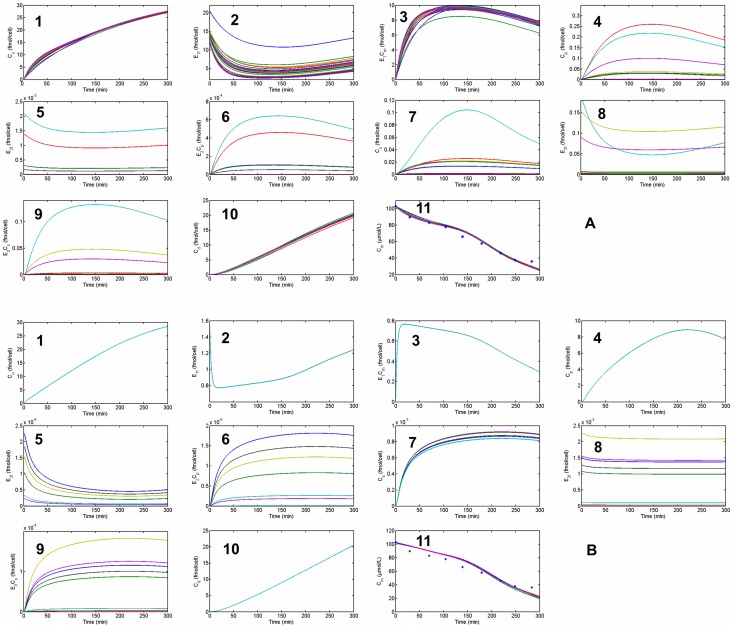
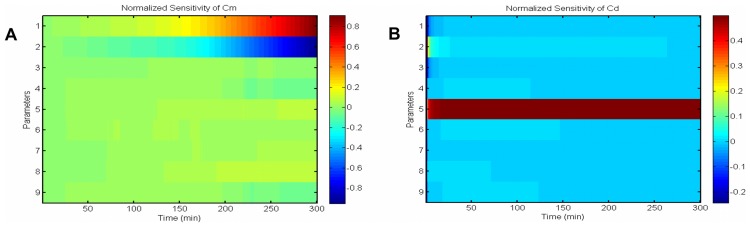
 , shows it is most sensitive to changes in
  and
and  . (B) Normalized sensitivity of deposited silica,
  , shows it is most sensitive to the changes of
  .
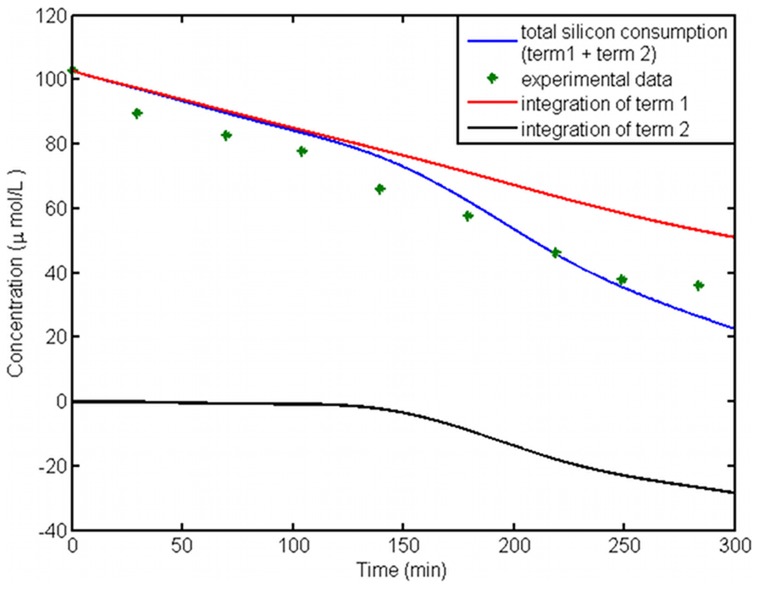
.
 ,
,  and
and  (solid line: original quantities - dotted lines: perturbed quantities).
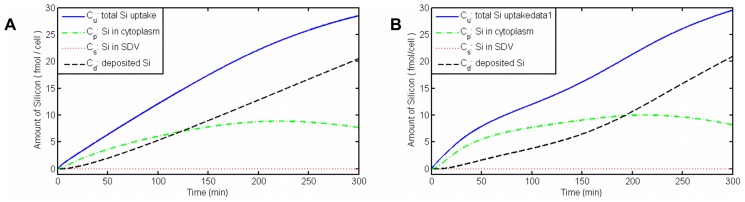
References
-
- Bush PC, Sejnowski TJ (1993) Reduced compartmental models of neocortical pyramidal cells. Journal of Neuroscience Methods 46: 159–166. - PubMed
-
- Loew LM, Schaff JC (2001) The Virtual Cell: a software environment for computational cell biology. TRENDS in Biotechnology 19: 401–406. - PubMed
-
- Mann S, Archibald DD, Didymus JM, Douglas T, Heywood BR, Fiona C Meldrum, et al. (1993) Crystallization at Inorganic-organic Interfaces: Biominerals and Biomimetic Synthesis. Science 261: 1286–1292. - PubMed
-
- Gröger C, Lutz K, Brunner E (2008) Biomolecular Self-assembly and its Relevance in Silica Biomineralization. Cell Biochem Biophys 50: 23–39. - PubMed
Publication types
MeSH terms
Substances
LinkOut - more resources
Full Text Sources
Other Literature Sources
