. 2014 Jun 19;10(6):e1004426.
doi: 10.1371/journal.pgen.1004426. eCollection 2014 Jun.

Identification of late larval stage developmental checkpoints in Caenorhabditis elegans regulated by insulin/IGF and steroid hormone signaling pathways

Affiliations

Identification of late larval stage developmental checkpoints in Caenorhabditis elegans regulated by insulin/IGF and steroid hormone signaling pathways

Adam J Schindler et al. PLoS Genet. .

Abstract

Organisms in the wild develop with varying food availability. During periods of nutritional scarcity, development may slow or arrest until conditions improve. The ability to modulate developmental programs in response to poor nutritional conditions requires a means of sensing the changing nutritional environment and limiting tissue growth. The mechanisms by which organisms accomplish this adaptation are not well understood. We sought to study this question by examining the effects of nutrient deprivation on Caenorhabditis elegans development during the late larval stages, L3 and L4, a period of extensive tissue growth and morphogenesis. By removing animals from food at different times, we show here that specific checkpoints exist in the early L3 and early L4 stages that systemically arrest the development of diverse tissues and cellular processes. These checkpoints occur once in each larval stage after molting and prior to initiation of the subsequent molting cycle. DAF-2, the insulin/insulin-like growth factor receptor, regulates passage through the L3 and L4 checkpoints in response to nutrition. The FOXO transcription factor DAF-16, a major target of insulin-like signaling, functions cell-nonautonomously in the hypodermis (skin) to arrest developmental upon nutrient removal. The effects of DAF-16 on progression through the L3 and L4 stages are mediated by DAF-9, a cytochrome P450 ortholog involved in the production of C. elegans steroid hormones. Our results identify a novel mode of C. elegans growth in which development progresses from one checkpoint to the next. At each checkpoint, nutritional conditions determine whether animals remain arrested or continue development to the next checkpoint.


Conflict of interest statement

The authors have declared that no competing interests exist.

Figures

Figure 1
Figure 1. Removal from food induces arrest in vulval development early in the L3 stage.
(A) Vulva development in the L3 and L4 larval stages. The 1°-fated vulval precursor cell (VPC), P6.p, expresses egl-17>GFP in green; P5.p and P7.p are specified to the 2° VPC fate. Basement membrane (BM; expressing LAM-1::GFP protein in green) separates the uterine and vulval epithelium. The uterine anchor cell (AC; expressing zmp-1>mCherry in magenta) is dorsal to P6.p and invades across BM between the first and second VPC divisions. The final VPC divisions occur at the time of the L3/L4 molt. Molting animals can be distinguished by the formation of buccal caps covering the mouth (inset, bottom left panel). (Top right of panel A) Cell divisions produce 22 VPC progeny that comprise seven vulval subtypes, vulA–vulF. Some of the cells divide along the left-right axis (hatched lines in early L4 schematic) outside the central plane of focus. In the mid L4 stage, the AC fuses with the surrounding uterine cells, and egl-17>GFP expression changes from the 1° to 2°-fated cells. At the end of L4, the cells turn partially inside out (evert). Times for each developmental stage are after release from L1 arrest at 20°C. (B) Late L2 nutrient deprivation assay. Animals were removed from food after 22 h growth at 20°C and either returned to food or kept deprived of food. Starting at time 0, both groups were maintained at RT (22°C). In the chart, developmental stages on the Y-axis were determined by the extent of vulval development and the molt, and the duration of feeding or removal from food is indicated on the X-axis. The areas of the circles in the chart reflect the percentage of the population at each stage of development; n≥50 for each time point. See Fig. S1 for raw data and results of replicate assays. (C) Animals after 2 d removal from food, with no divisions of P5.p–P7.p, and expressing the 1° fate marker, egl-17>GFP (top), or the 2° fate marker lip-1>NLS-GFP (bottom). In these and other figures, anterior is left. Scale bars, 10 µm.
Figure 2
Figure 2. Vulval development arrests at a precise time in the L4 stage.
(A) Schematic and chart for mid L3 nutrient removal assay. A wild type population was grown for 28 h at 20°C and removed from food. Stages of vulval development were assessed in fed and nutrient deprived groups as described in Fig. 1B; n≥50 for each time point. (B) Image of L4-arrested animal 48 h after removal from food. egl-17>GFP was expressed exclusively in 1° VPC progeny and VPC divisions had completed. The AC, expressing zmp-1>mCherry, invaded across basement membrane but did not fuse with the surrounding uterine cells. (C) Schematic of early L4 nutrient deprivation assay, with animals grown for 36 h at 20°C and scored for developmental stage as described for Figs. 1B and 2A. See Fig. S1 for raw data and replicates of assays in (A) and (C). (D) Adult animal after 2 d removal from food, with eversion of the vulva. Scale bars, 10 µm.
Figure 3
Figure 3. A systemic mechanism coordinates the timing of L3 arrest.
(A) Precocious VPC divisions in hbl-1(ve18) mutant animals. At the time of the L2/L3 molt, P5.p and P6.p have undergone cell divisions. (B) Variable number of P6.p progeny after 2 d removal from food. The number of P6.p progeny was counted when food was removed late in the L2 stage, and again after 2 d. (C) Image of hbl-1(ve18) after 2 d removal from food, with four P6.p progeny and two P5.p progeny. The AC (signified by white arrow) has not breached the basement membrane, indicative of arrest early in the L3 stage. Scale bars, 10 µm.
Figure 4
Figure 4. Arrest occurs at a specific time in the larval stage and molting cycle.
(A) Percentage of animals with pharyngeal pumping in fed and nutrient-deprived groups maintained at 22°C; n≥50 at each time point per group. Absence of pharyngeal pumping indicates that animals are in lethargus. (B) An L3-arrested animal having completed ecdysis of the L2 cuticle, after 24 h in the absence of food. The shed cuticle surrounds the head. (C) Images of fed and nutrient-deprived animals expressing the molting cycle reporter gene mlt-10>GFP-PEST. Chart shows quantification of mlt-10>GFP-PEST expression levels over an 8 h interval starting late in the L2 stage. Error bars ± S.D. for n≥30 at each time point. Scale bars, 10 µm.
Figure 5
Figure 5. The insulin-like signaling pathway regulates progression past the L3 and L4 checkpoints.
(A) daf-16(mu86) animals were grown to late in the L2 stage, removed from food, and the stage of development assessed at intervals using vulval development and the molt as markers; n≥50 at each time point. (B) Similar assay as in (A), with daf-16(mu86) animals grown to late in the L3 stage. See Fig. S5 for raw data and replicates of assays in (A) and (B). (C) Images of daf-16(mu86) animals after 2 d removal from food and arrested in the early L3 (top) or early L4 (bottom) stages. No VPC divisions were observed in L3-arrested animals, and VPCs completed divisions in L4-arrested animals. (D) Wild type, daf-2(e1370), and daf-2(e1370); daf-16(mu86) animals were fed to the mid L2 stage at 15°C and shifted to 25°C. After 24 h additional feeding at 25°C, the developmental stage was examined for n = 100 animals per genotype. In the presence of food, daf-2(e1370) animals paused preferentially early in the L3 and L4 stages (highlighted in magenta). Scale bar, 10 µm.
Figure 6
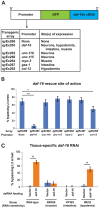
Figure 6. Expression of DAF-16 in the hypodermis regulates the L3 nutritional response.
(A) A schematic diagram of transgenes tested for rescue of the daf-16(mu86) bypass phenotype and their sites of expression (see also Supplemental Fig. 6). (B) daf-16(mu86) animals expressing the transgenic arrays in (A) were assayed for bypass of L3 arrest. Averages of 3 assays; n≥50 per assay. Error bars denote 95% confidence interval; *p<.0001, **p<.001 by two-tailed Fisher's exact test. (C) Wild type and tissue-specific RNAi sensitive strains (see Experimental Procedures for descriptions) were fed either L4440 (empty vector control) or daf-16 dsRNA, and the percentage of animals bypassing L3 arrest were measured 2 d after removal from food. Average of 5 assays (wild type) or 3 assays (all others); n≥50 per assay. Error bars denote 95% confidence interval; *p<.0001 by two-tailed Fisher's exact test.
Figure 7
Figure 7. DAF-9 regulates L3 and L4 arrest downstream of DAF-16.
(A) daf-16(mu86) animals were fed either L4440 (empty vector) or daf-9 dsRNA and the percentage of animals bypassing L3 and L4 arrest measured 2 d after removal from food. Average of 3 assays; n≥50 per assay. Error bars denote 95% confidence interval; *p<.0001 by two-tailed Fisher's exact test. (B) DAF-9::GFP (dhIs64) animals were removed from food late in the L2 stage and developmental progression assessed for n≥50 at each time point. See Fig. S5 for raw data and replicates. (C) Images of adult DAF-9::GFP–expressing animals. Top shows a tail region with both the L3 and L4 cuticles (arrows) still attached. Bottom is a dead or dying animal that has not shed the L4 cuticle surrounding the head (arrow). (D) Normalized expression levels of hypodermal DAF-9::GFP following nutrient deprivation late in the L2 stage. After 24 h, some animals still had detectable levels of the transgene. Error bars ± S.E.M.; n = 20 for each time point. Scale bars, 10 µm.
Figure 8
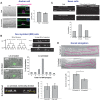
Figure 8. Arrest of tissues in the L3 and L4 stages.
(A) Anchor cell (AC) arrest. Both fed and nutrient-deprived animals showed polarization of the AC-specific F-actin probe cdh-3>mCherry::moesinABD. Insets show heat maps of cdh-3>mCherry::moesinABD. Chart is quantification of polarity in fed and nutrient-deprived groups. Error bars ± S.E.M.; n = 16 per group. (B) Sex myoblast (SM) arrest. The SM cells divide three times between the mid L3 and early L4 stages, as depicted in the cell lineage diagram. Following cell divisions, the progeny cells (visualized with an HLH-8::GFP reporter gene) undergo short-range migrations during the L4 stage. In L3-arrested animals, no cell divisions occurred (n = 30). In animals removed from food in mid L3 that had arrested in early L4, two rounds of cell divisions typically occurred, although variability was present in the population. Graph shows percentage of the population with the indicated number of SM cell progeny (n = 30). When animals were grown to later times in L3 to allow completion of cell divisions, the short-range cell migrations that occur during the L4 stage were not observed. Chart compares distances between the nuclei of the two inner cells from each group of four (white brackets), which move closer together during the L4 stage, with the distance between the nuclei of the two outer cells (yellow brackets), which move further away from each other during L4. Error bars ± S.D.; n = 20 per group; p = .36 by two-tailed Student's t-test. (C) Seam cell arrest. Seam cells, which are separated by adherens junctions, divide during the molt, followed by fusion of the anterior daughter cell and re-formation of adherens junctions early in the larval stage. When animals were removed from food in the L3 stage and examined after 2 d, seam cells showed a variable pattern of arrest. In the top image, the posterior seam cells have divided but the anterior cells have not. In the bottom image, seam cells have divided and anterior daughter cells have fused, but the adherens junctions that separate cells have not re-formed. Chart shows quantification of arrested state in the V1 seam cell 2 d after food removal (n = 30). Seam cells were visualized with an AJM-1::GFP reporter gene. (D) Gonad elongation arrest. One of two gonad arms, outlined in magenta, in a fed early L4 animal and in an animal removed from food in the mid L3 stage. n = 20 animals; error bars ± S.D.; *p<1×10⁻¹⁰ by two-tailed Student's t-test. Scale bars, 10 µm.
Figure 9
Figure 9. Model for nutritional regulation of L3 and L4 larval stage progressions.
(Top) Feeding leads to the generation of insulin-like peptides (ILPs) that bind to the DAF-2 receptor, leading to the inhibition of DAF-16 activity. Inhibition of DAF-16 promotes expression of DAF-9 and the generation and release of steroid hormones, which allow animals to bypass the early L3 and early L4 checkpoints. (Bottom) In the absence of food, DAF-2 no longer inhibits DAF-16, which suppresses the expression of DAF-9 and the release of steroid hormones, causing animals to arrest at the checkpoints.

References

    1. Tennessen JM, Thummel CS (2011) Coordinating growth and maturation - insights from Drosophila. Curr Biol 21: R750–757. - PMC - PubMed
    1. Baugh LR (2013) To grow or not to grow: nutritional control of development during Caenorhabditis elegans L1 arrest. Genetics 194: 539–555. - PMC - PubMed
    1. Hu PJ (2007) Dauer. WormBook 1–19. - PMC - PubMed
    1. McCue MD (2010) Starvation physiology: reviewing the different strategies animals use to survive a common challenge. Comp Biochem Physiol A Mol Integr Physiol 156: 1–18. - PubMed
    1. Golden JW, Riddle DL (1984) The Caenorhabditis elegans dauer larva: developmental effects of pheromone, food, and temperature. Dev Biol 102: 368–378. - PubMed

Publication types

MeSH terms

LinkOut - more resources