. 2014 Jun 18;82(6):1263-70.
doi: 10.1016/j.neuron.2014.04.038.

Norepinephrine controls astroglial responsiveness to local circuit activity

Affiliations

Norepinephrine controls astroglial responsiveness to local circuit activity

Martin Paukert et al. Neuron. .

Abstract

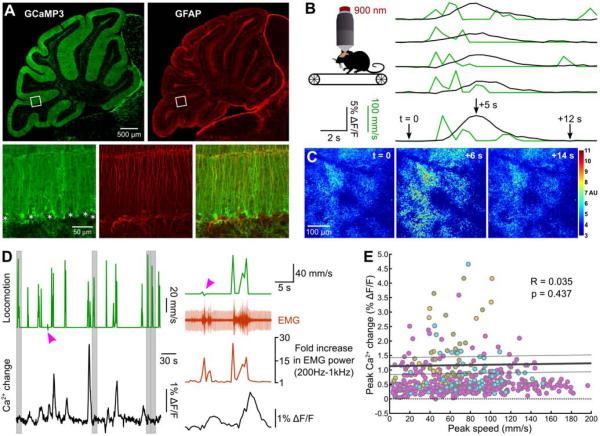
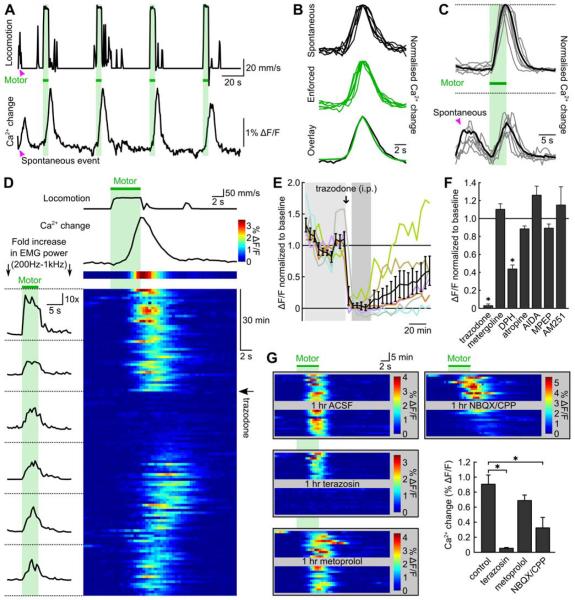
Astrocytes perform crucial supportive functions, including neurotransmitter clearance, ion buffering, and metabolite delivery. They can also influence blood flow and neuronal activity by releasing gliotransmitters in response to intracellular Ca(2+) transients. However, little is known about how astrocytes are engaged during different behaviors in vivo. Here we demonstrate that norepinephrine primes astrocytes to detect changes in cortical network activity. We show in mice that locomotion triggers simultaneous activation of astrocyte networks in multiple brain regions. This global stimulation of astrocytes was inhibited by alpha-adrenoceptor antagonists and abolished by depletion of norepinephrine from the brain. Although astrocytes in visual cortex of awake mice were rarely engaged when neurons were activated by light stimulation alone, pairing norepinephrine release with light stimulation markedly enhanced astrocyte Ca(2+) signaling. Our findings indicate that norepinephrine shifts the gain of astrocyte networks according to behavioral state, enabling astrocytes to respond to local changes in neuronal activity.


Figures

Figure 1
Figure 1. Weak correlation between voluntary locomotion and Ca2+ elevation in Bergmann glia
A, Cerebellar section from 5 week-old GLAST-CreER;R26-lsl-GCaMP3 mouse immunostained for GCaMP3 and glial fibrillary acidic protein (GFAP). Boxed areas are shown at higher magnification below. Asterisks highlight Purkinje cell somata devoid of fluorescence. B, Left, schematic of imaging configuration. Right, five representative trials showing Bergmann glia Ca2+ increase (GCaMP3 fluorescence, black traces) relative to mouse locomotion (optical encoder, green traces). C, Images of GCaMP3 fluorescence in Bergmann glial processes at times indicated by arrows in B. D, Left, continuous record of locomotion (green trace) and Bergmann glia Ca2+ levels (GCaMP3 fluorescence). Grey bars highlight periods when locomotion was not associated with Bergmann glia Ca2+ elevations. Arrowhead highlights a Bergmann glia Ca2+ transient that was not associated with locomotion. Right, expanded portion of trial including electromyography (EMG) signal. Arrowhead indicates timing of Bergmann glia Ca2+ elevation. E, Plot of locomotion speed and Bergmann glia Ca2+ change (GCaMP3 fluorescence) for 707 locomotion periods from 4 mice. Colors represent trails from different individuals. Black lines represent mean ± SEM of 4 regression lines.
Figure 2
Figure 2. Noradrenergic signaling is required for locomotion-induced activation of Bergmann glia
A, Spontaneous (arrowhead) and enforced (green bars) locomotion and corresponding Bergmann glia Ca2+ levels (GCaMP3 fluorescence). B, Normalized Bergmann glia Ca2+ changes associated with spontaneous (6 of 13 events) and enforced locomotion (6 of 159 events) from experiment in A. C, Individual (gray traces) and average (black traces) Bergmann glia Ca2+ transients resulting from enforced locomotion with (lower traces) or without (upper traces) a preceding spontaneous event. D, Consecutive trials of enforced locomotion (green bar) pseudocolored according to magnitude of Ca2+ change. Arrow indicates time of trazodone injection (10 mg/kg i.p.). Left, average EMG power during 20 consecutive trials at right. E, Normalized amplitude of Bergmann glia Ca2+ elevations elicited by enforced locomotion. Each point is average of 4 consecutive trials normalized to baseline. Regions highlighted by light grey bar used to determine baseline and dark grey bar the maximal response to drug. Black symbols represent mean ± SEM. F, Effect of neuromodulatory receptor antagonists on Bergmann glia Ca2+ response to enforced locomotion. Columns represent mean ± SEM. Concentrations from left (mg/kg i.p.): 10, 10, 20, 20, 20, 20, 10. Number of experiments from left: 6, 5, 5, 5, 5, 4, 3. Asterisks indicate significant reduction relative to baseline in one-way ANOVA followed by Bonferroni post-hoc test. G, Bergmann glia Ca2+ transients in consecutive trials of enforced locomotion before and after local application of antagonists. Summary graph is mean ± SEM. Concentrations (μM): 100 terazosin, 3 metoprolol, 300/200 NBQX/CPP. Number of experiments from left: 8, 5, 5, 5. Asterisks indicate significant difference in one-way ANOVA followed by Bonferroni post-hoc test.
Figure 3
Figure 3. Locomotion induces simultaneous activation of astroglia in different regions of the brain
A, Parasagittal section of GLAST-CreER;R26-lsl-GCaMP3 mouse (P57) immunostained for GCaMP3. crus1 (C1), lobulus simplex (LS), primary visual cortex (V1). B, Higher magnification image of GCaMP3 (green) and GFAP (red) in V1. C, In vivo image of V1, layer 1 (70 μm below pial surface) cortical astrocytes expressing GCaMP3 in 3 month-old GLAST-CreER;R26-lsl-GCaMP3 mouse. D, Mean change in cytosolic Ca2+ (GCaMP3) in V1 cortical astrocytes (black trace) induced by enforced locomotion (green trace). Green bar: period of enforced locomotion; green trace: locomotion; red trace fold increase in EMG activity. E, Images of GCaMP3 fluorescence in V1 astrocytes at times indicated in D. F, Schematic of dual fiber optic photometry configuration. G, Ca2+ changes in Bergmann glia and V1 astrocytes visualized simultaneously during enforced locomotion (green bars) and corresponding EMG activity. H, Co-variance between Bergmann glia and V1 astrocyte Ca2+ changes during spontaneous locomotion. n = 348 spontaneous locomotion events from 6 mice. Black lines represent mean ± SEM of 6 regression lines.
Figure 4
Figure 4. Norepinephrine enhances the sensitivity of astrocytes to local circuit activity
A, V1 astrocyte Ca2+ responses to enforced locomotion (green bars), visual stimulation (blue bars) or simultaneous enforced locomotion and visual stimulation (gray bars). Red traces represent EMG activity, black traces represent mean Ca2+ change in all astrocytes. Lower panel represents Ca2+ changes in individual astrocytes pseudocolored according to amplitude. Arrowhead highlights Ca2+ elevation associated with spontaneous locomotion. B, Ca2+ transients in 4 representative cells during 4 consecutive trials of enforced locomotion (green bars) or simultaneous enforced locomotion and visual stimulation (grey bars). C, Left, average fraction of astrocytes responding with a mean Ca2+ elevation exceeding 1% ΔF/F. Right, average maximum Ca2+ responses in individual astrocytes (16 - 20 trials). Bars represent mean ± SEM; n = 20 mice; asterisks indicate significant difference (one-way ANOVA with Bonferroni post-hoc test). D, Left, mean Ca2+ elevations in all astrocytes (16 - 20 trials). Colored lines connect data points from individual mice. Asterisks indicate significant difference (one-way ANOVA with Bonferroni post-hoc test). Right, change in EMG power during enforced locomotion or simultaneous enforced locomotion and visual stimulation. Each point represents average response in 16 - 20 trials. Red circles indicate mean of all trials.

Comment in

References

    1. Attwell D, Buchan AM, Charpak S, Lauritzen M, MacVicar BA, Newman EA. Glial and neuronal control of brain blood flow. Nature. 2010;468:232–243. - PMC - PubMed
    1. Bekar LK, He W, Nedergaard M. Locus coeruleus alpha-adrenergic-mediated activation of cortical astrocytes in vivo. Cereb. Cortex. 2008;18:2789–2795. - PMC - PubMed
    1. Cahoy JD, Emery B, Kaushal A, Foo LC, Zamanian JL, Christopherson KS, Xing Y, Lubischer JL, Krieg PA, Krupenko SA, et al. A transcriptome database for astrocytes, neurons, and oligodendrocytes: a new resource for understanding brain development and function. J. Neurosci. 2008;28:264–278. - PMC - PubMed
    1. Di Castro MA, Chuquet J, Liaudet N, Bhaukaurally K, Santello M, Bouvier D, Tiret P, Volterra A. Local Ca2+ detection and modulation of synaptic release by astrocytes. Nat. Neurosci. 2011;14:1276–1284. - PubMed
    1. Chen N, Sugihara H, Sharma J, Perea G, Petravicz J, Le C, Sur M. Nucleus basalis-enabled stimulus-specific plasticity in the visual cortex is mediated by astrocytes. Proc. Natl. Acad. Sci. U. S. A. 2012;109:E2832–41. - PMC - PubMed

Publication types

LinkOut - more resources