. 2014 Jun 19;9(6):e99989.
doi: 10.1371/journal.pone.0099989. eCollection 2014.

Promoter-bound p300 complexes facilitate post-mitotic transmission of transcriptional memory

Affiliations

Promoter-bound p300 complexes facilitate post-mitotic transmission of transcriptional memory

Madeline M Wong et al. PLoS One. .

Erratum in

  • PLoS One. 2014;9(8):e106126

Abstract

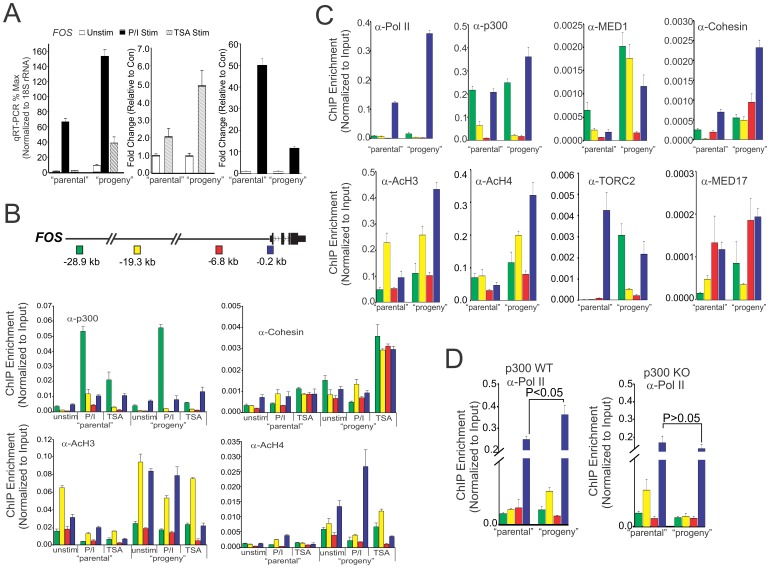
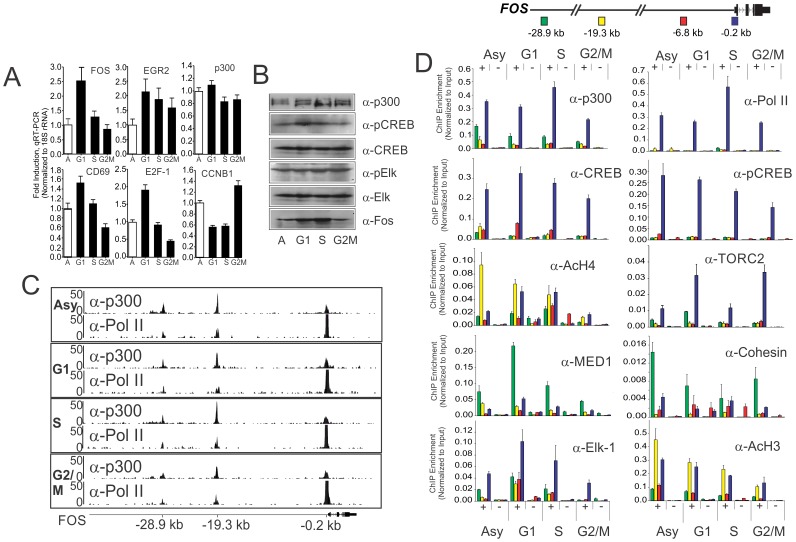
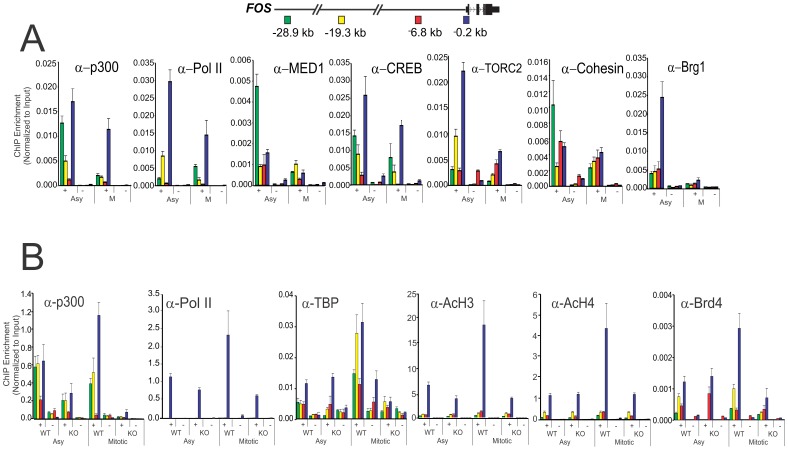
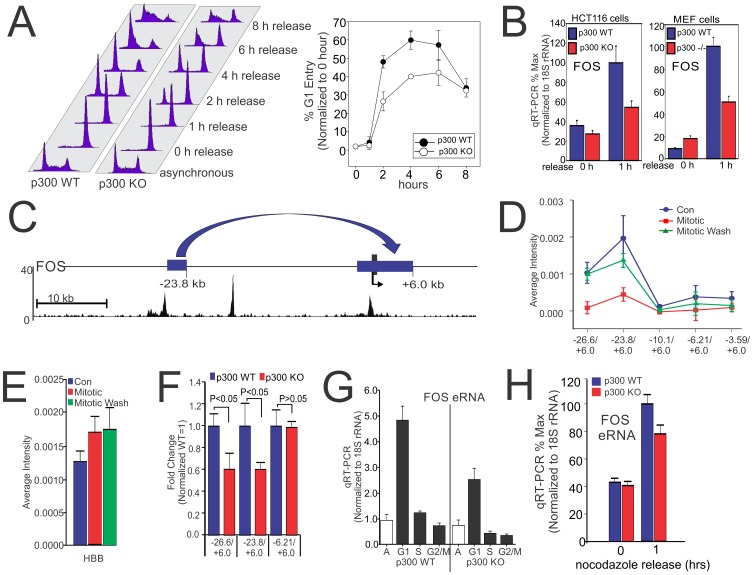
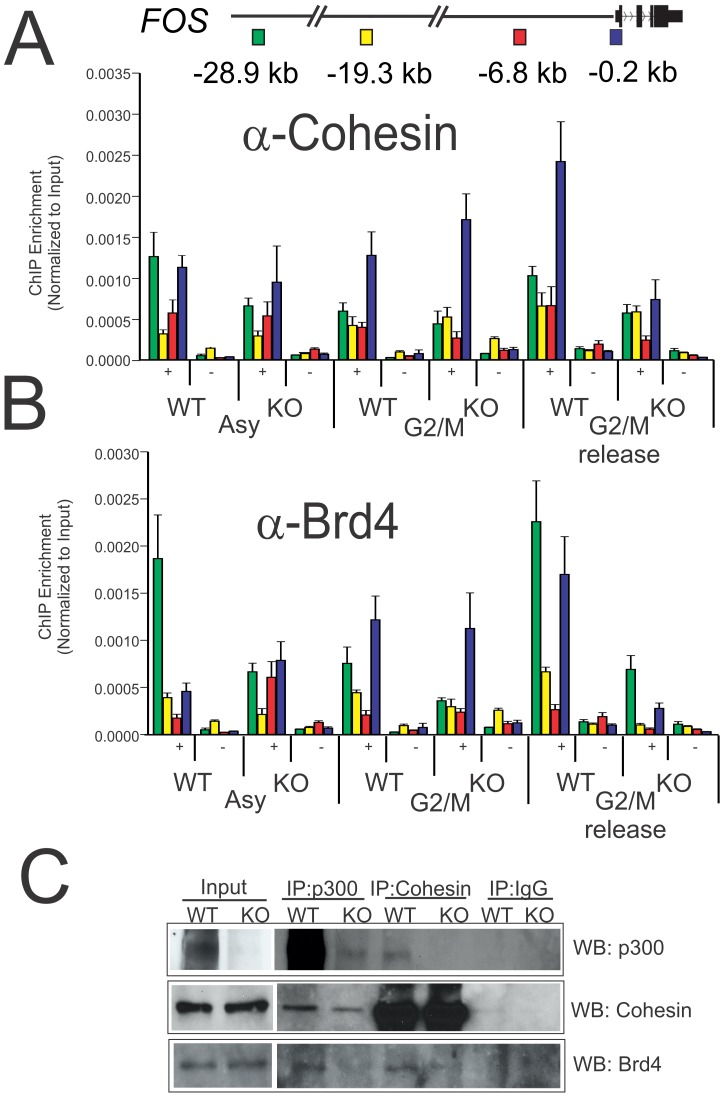
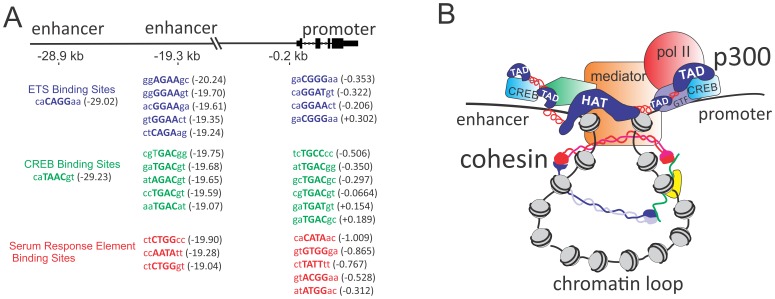
A central hallmark of epigenetic inheritance is the parental transmission of changes in patterns of gene expression to progeny without modification of DNA sequence. Although, the trans-generational conveyance of this molecular memory has been traditionally linked to covalent modification of histone and/or DNA, recent studies suggest a role for proteins that persist or remain bound within chromatin to "bookmark" specific loci for enhanced or potentiated responses in daughter cells immediately following cell division. In this report we describe a role for p300 in enabling gene bookmarking by pre-initiation complexes (PICs) containing RNA polymerase II (pol II), Mediator and TBP. Once formed these complexes require p300 to enable reacquisition of protein complex assemblies, chromatin modifications and long range chromatin interactions that facilitate post-mitotic transmission of transcriptional memory of prior environmental stimuli.


Conflict of interest statement

Competing Interests: The authors have declared that no competing interests exist.

Figures

Figure 1
Figure 1. p300 facilitates parental trans-generational transmission of remembered states of potentiated transcriptional function.
(A) Jurkat cells were treated with PMA and Ionomycin (P/I) for 1 h “parental”. Cells were then washed and allowed to rest for 40 h. qRT-PCR profile showing FOS expression in resting Jurkat cells (“parental”) or Jurkat cells pre-treated with P/I (mitogen pulsed) for 1 h, washed, allowed to rest for 40 h (“progeny”) and restimulated with P/I (1 h) and TSA (2 h). The fold induction upon TSA stimulation (middle) or P/I stimulation (right) are presented as relative level compared to the amount present in the unstimulated population. (B) Position dependent profile of p300, Cohesin, acetylated histone H3 (AcH3) and acetylated histone H4 (AcH4) at the FOS locus of Jurkat cells as determined by quantitative ChIP analysis. Error bars represent standard error of the mean from 2 biological replicates each determined in duplicate. Shown above is a schematic of the locations of enhancers (−28.9 kb & −19.3 kb), upstream (−6.8 kb) and promoter (−0.2 kb) at the FOS locus relative to TSS. (C) Position dependent profile at the FOS locus of Jurkat cells, relative to TSS, for indicated factors as determined by quantitative ChIP analysis. Error bars represent standard error of the mean from 2 biological replicates each determined in duplicate. (D) Position dependent profiles of pol II at the FOS locus in p300 WT and p300 KO in HCT 116 cells. Error bars represent standard error of the mean from 2 biological replicates, each determined in duplicate.
Figure 2
Figure 2. A pre-initiation complex containing p300 remains assembled at the FOS promoter and distal enhancers throughout the cell cycle.
Jurkat cells were elutriated to obtain populations of cells at different stages of the cell cycle. (A) qRT-PCR profile showing expression of immediate early genes peaks at the G1 phase of the cell cycle. The fold induction present at each phase (G1, S and G2/M) is presented as relative level compared to the amount present at the asynchronous phase (A) Error bars represent standard error of the mean from 4 biological replicates each determined in triplicate. (B) Western blots showing protein levels of p300, total and phospho-CREB, total and phospho-Elk and FOS at different stages of the cell cycle. Shown is 1 of 3 independent biological replicate of elutriations. (C) ChIP-Seq profiles of the binding of p300 and pol II at the FOS promoter and distal enhancers. Shown is 1 of 2 independent biological replicate of elutriations. (D) Position dependent profile at the FOS locus for indicated antibodies (+) and no antibody control (−) as indicated determined by quantitative ChIP analysis throughout the cell cycle. Error bars represent standard error of the mean from 3 or 4 biological replicates each determined in duplicate. Above is shown a schematic of the locations of enhancers (−28.9 kb & −19.3 kb), upstream (−6.8 kb) and promoter (−0.2 kb) at the FOS locus relative to TSS as indicated.
Figure 3
Figure 3. p300 is required for retention of enhancer and promoter bound PIC components in mitotic cells.
(A) Position dependent profile at the FOS relative to TSS of indicated factors (+) and no antibody control (−) determined by quantitative ChIP analysis in asynchronous (Asy) versus mitotic (M) Jurkat cells. Error bars represent standard error of the mean from 3 biological replicates each determined in duplicate. Jurkat cells were treated with nocodazole (400 ng/ml) for 24 h to obtain metaphase (M-phase) population. (B) Position dependent profile at the FOS locus relative to TSS of indicated factors (+) and no antibody control (−) determined by quantitative ChIP analysis in asynchronous (Asy) versus mitotic (M) p300 WT and p300 KO in HCT 116 cells. Error bars represent standard error of the mean from 2 biological replicates each determined in duplicate. A schematic of the locations of enhancers (−28.9 kb & −19.3 kb), upstream (−6.8 kb) and promoter (−0.2 kb) at the FOS locus relative to TSS is shown above.
Figure 4
Figure 4. p300 is required for G1 re-entry and re-establishment of long range chromatin interaction at the FOS locus.
(A) p300 WT and p300 KO HCT116 cells were treated as in Figure 3B, and released after washing. Cell cycle analysis by flow cytometric (FACS) for DNA content (Propidium Iodide staining) of cell before (Asynchronous) and after release from nocodazole treatment (16 h). Graphical representation of percentage of G1 cells is shown. Error bars represent standard error of the mean from 2 biological replicates. (B) qRT-PCR profile showing expression of FOS in the respective cell lines upon nocodazole treatment and release. Error bars represent standard error of the mean from 2 biological replicates. (C) A schematic of the locations of Chromosome Conformation Capture (3C) sites at the FOS locus relative to TSS with p300 localization as determined by ChIP-Seq. Jurkat cells were treated as in Figure 3A and washed and collected after 2 h. 3C assay was carried out and average intensity of PCR bands of respective primers of the FOS locus [Chr 14: 74822063 (+6.0 kb), 74788795 (−26.6 kb), 74791374 (−23.8 kb), 74805069 (−10.1 kb), 74808985 (−6.2 kb) and 74811601 (−3.59 kb)] (D) and HBB locus [Chr 11: 5209027 and 5199783] (E) were quantified. Error bars represent standard error of the mean from 3 biological replicates. (F) Comparison of 3C sites of the FOS locus between p300 WT and p300 KO in HEK293 cells. Error bars represent standard error of the mean from 5 biological replicates. (G) qRT-PCR profile showing expression of FOS enhancer RNA (eRNA) across the cell cycle in p300 WT and p300 KO cells. Error bars represent standard error of the mean from 2 biological replicates each determined in triplicate. (H) qRT-PCR profile showing expression of FOS eRNA expression in p300 WT or p300 depleted cells upon nocodazole treatment and released. Error bars represent standard error of the mean from 2 biological replicates determined in triplicate.
Figure 5
Figure 5. p300 is required for post-mitotic recruitment of Cohesin and Brd4.
Jurkat p300 WT and p300 KO cells were elutriated to obtain cells of G2/M population and allowed to progress for 20 min to the G1 phase of the cell cycle. A schematic of the locations of enhancers (−28.9 kb & −19.3 kb), upstream (−6.8 kb) and promoter (−0.2 kb) at the FOS locus relative to TSS as indicated. Position dependent profile at the FOS locus for (A) Cohesin and (B) Brd4 antibodies (+) and no antibody control (−) as indicated determined by quantitative ChIP analysis. Error bars represent standard error of the mean from 2 biological replicates each determined in duplicate. (C) ChIP-western showing p300 dependency for Cohesin and Brd4 interaction. Shown is 1 of 2 independent biological replicates.
Figure 6
Figure 6. Role of p300 in stabilizing long-range promoter enhancer interactions.
(A) Schematic table showing clusters of ETS, CREB, and SRE binding sites shared across enhancer and promoter elements at the FOS locus. (B) Schematic representation of possible interaction between p300, Mediator, Cohesin and bound general and sequence specific transcription factors.

References

    1. Delcuve GP, Rastegar M, Davie JR (2009) Epigenetic control. J Cell Physiol 219: 243–250. - PubMed
    1. Sarge KD, Park-Sarge OK (2009) Mitotic bookmarking of formerly active genes: keeping epigenetic memories from fading. Cell Cycle 8: 818–823. - PMC - PubMed
    1. Ng RK, Gurdon JB (2008) Epigenetic memory of an active gene state depends on histone H3.3 incorporation into chromatin in the absence of transcription. Nat Cell Biol 10: 102–109. - PubMed
    1. Christova R, Oelgeschlager T (2002) Association of human TFIID-promoter complexes with silenced mitotic chromatin in vivo. Nat Cell Biol 4: 79–82. - PubMed
    1. Young DW, Hassan MQ, Yang XQ, Galindo M, Javed A, et al. (2007) Mitotic retention of gene expression patterns by the cell fate-determining transcription factor RUNX2. Proc Natl Acad Sci U S A 104: 3189–3194. - PMC - PubMed

Publication types

MeSH terms

LinkOut - more resources