. 2014 Jun 19;9(6):e100629.
doi: 10.1371/journal.pone.0100629. eCollection 2014.

Nfatc2 and Tob1 have non-overlapping function in T cell negative regulation and tumorigenesis

Affiliations

Nfatc2 and Tob1 have non-overlapping function in T cell negative regulation and tumorigenesis

Sarah L May et al. PLoS One. .

Abstract

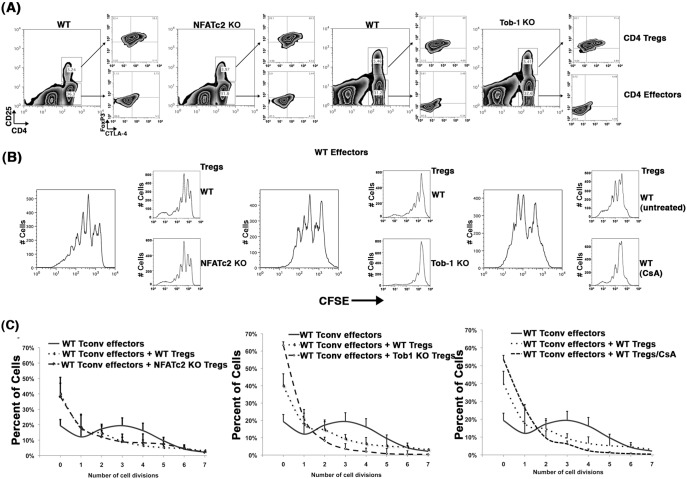
Nfatc2 and Tob1 are intrinsic negative regulators of T cell activation. Nfatc2-deficient and Tob1-deficient T cells show reduced thresholds of activation; however, whether these factors have independent or overlapping roles in negative regulation of T cell responses has not been previously examined. Here, we show that Nfatc2 knockout (KO) but not Tob1 KO mice have age-associated accumulation of persistently activated T cells in vivo and expansion of the CD44+ memory cell compartment and age-associated lymphocytic infiltrates in visceral organs, without significant changes in numbers of CD4+CD25+Foxp3+ regulatory T cells (Treg). In vitro, CD4+CD25- "conventional" T cells (Tconvs) from both KO strains showed greater proliferation than wild type (WT) Tconvs. However, while Tregs from Nfatc2 KO mice retained normal suppressive function, Tregs from Tob1 KOs had enhanced suppressive activity. Nfatc2 KO Tconvs expanded somewhat more rapidly than WT Tconvs under conditions of homeostatic proliferation, but their accelerated growth capacity was negated, at least acutely, in a lymphoreplete environment. Finally, Nfatc2 KO mice developed a previously uncharacterized increase in B-cell malignancies, which was not accelerated by the absence of Tob1. The data thus support the prevailing hypothesis that Nfatc2 and Tob1 are non-redundant regulators of lymphocyte homeostasis.


Conflict of interest statement

Competing Interests: The authors have declared that no competing interests exist.

Figures

Figure 1
Figure 1. Nfatc2 and Tob1 KO mice have increased numbers of persistently activated cells in vivo.
Spleen and lymph node cells were isolated from age-matched WT, Nfatc2 KO, and Tob1 KO mice, and cells from each genotype and for each organ were pooled for experiments. Expression of CDK4 was measured by intracellular staining and expression of CD69 was measured by conventional cell surface staining of freshly isolated cells. (A). One-dimensional histograms (top) showing CDK4 expression, gated on CD4 and CD8 cells from representative Nfatc2 KO and Tob1 KO mice overlaid on WT controls as indicated. Dark lines in the histograms represent KOs and grey lines represent WT mice. Bar graphs (bottom) represent means ± SD of the mean fluorescence intensity (MFI) for CDK4 expression in CD4 and CD8 cells. Data summarize 15, 12, and 5 experiments using triplicate samples of WT cells, Nfatc2 KO cells, Tob1 KO cells, respectively, each with pooled cells from 2 or 3 mice. MFIs among different experiments showed normal distribution. Asterisks denote values that are significantly different from WT (Student t-test p<0.05). (B) One-dimensional histograms (top) showing CD69 expression, gated on CD4 and CD8 cells from representative young (left) and old (right) Nfatc2 KO and Tob1 KO mice overlaid on WT controls as indicated. Dark lines in the histograms represent KOs and grey lines represent WT mice. Bar graphs (bottom) represent means ± SD percent CD69+ cells in the CD4 and CD8 compartments. Data for young and old mice summarize 10 and 4 experiments using triplicate samples of WT cells, 6 and 8 experiments using triplicate samples of Nfatc2 KO cells, and 4 and 3 experiments using triplicate samples of Tob1 KO cells, respectively. The percent of positive cells among different experiments showed normal distribution. Asterisks denote values that are significantly different from WT (Student t-test p<0.05).
Figure 2
Figure 2. Nfatc2 KO mice, but not Tob1 KO mice show age-related accumulation of memory T cells.
(A) Spleen and lymph node cells were isolated from age-matched WT, Nfatc2 KO, and Tob1 KO mice, and cells from each genotype and for each organ were pooled for experiments. Expression of CD44 and CD62L was measured by conventional cell surface staining in WT, Nfatc2 KO, and Tob1 KO T cells immediately after isolation from spleens or lymph nodes. Panels are representative two-dimensional contour plots showing CD44 and CD62L staining from young (top) and old (bottom) mice gated on CD3 T cells from representative mice as indicated. Similar data for young and old mice were obtained in 9 and 4 experiments using WT cells, 6 and 4 experiments using Nfatc2 KO cells, and 4 and 4 experiments using Tob1 KO cells, respectively. Means ± SD are provided in Table 1.
Figure 3
Figure 3. T cell expansion in Nfatc2 and Tob1 KO mice is not due to Treg dysfunction.
CD4 T cells were isolated from single cell suspensions of spleens and lymph nodes from age-matched WT, Nfatc2 KO, and Tob1 KO mice by negative immunomagnetic selection. CD4+CD25 (Tconv) cells and CD4+CD25+ (Tregs) were enriched by sorting. Tconv cells were labeled with CFSE and Treg cells were labeled with PKH26. Tconvs (100,000/well) were then mixed 1∶1 with syngeneic AgPCs and stimulated with anti-CD3 in the presence of absence of 50,000 Treg cells as indicated. Proliferation was measured by CFSE dilution in CD4 T cells using flow cytometry after of 96 hr of culture. (A) Expression of CD4, CD25, and CTLA-4 was assessed by conventional cell surface staining; expression of Foxp3 was examined by intracellular staining Panels are representative two-dimensional contour plots showing CD4 and CD25 staining from WT, Nfatc2 KO, and Tob1 KO mice gated on CD3 T cells. Boxed areas represent CD4+CD25+ (Treg) cells and CD4+CD25 (Tconv) cells. Small panels to the right represent two-dimensional contour plots showing CTLA-4 and Foxp3 staining, respectively for Tregs on top and Tconvs below. (B) Representative one-dimensional histograms of CFSE dilution from stimulated WT cells. Small panels to the right represent one-dimensional histograms of CFSE dilution for the same WT cells, respectively with the addition of WT Tregs, Nfatc2 KO Tregs, Tob1 KO Tregs, or WT Tregs treated with CsA as indicated. (C) Means ± S.D. of the percent of cells that underwent 0–7 divisions over 96 hr for each genotype with and without Tregs. The data summarize 8 experiments using WT Tregs, 4 experiments using Nfatc2 KO Tregs, 2 experiments using Tob1 KO Tregs, and 2 experiments using WT Tregs treated with CsA, each with pooled cells from 2 or 3 mice. The number of WT Tconv cells that did not undergo cell division was significantly greater (p<0.01), and the number of cells undergoing 2 or more divisions was significantly reduced (p<0.0001) when Tob1 KO Tregs were present in the culture than when WT Tregs or Nfatc2 KO Tregs were present in the culture.
Figure 4
Figure 4. Nfatc2 and Tob1 KOs lead to hyper-proliferative T-cell responses in vitro.
CD4 T cells were isolated from single cell suspensions of spleens and lymph nodes of age-matched WT, Nfatc2 KO, and Tob1 KO mice by negative immunomagnetic selection. CD4+CD25 (Tconv) cells were then enriched by depletion of CD4+CD25+ (Treg) cells and labeled with CFSE. Tconv cells were mixed 1∶1 with syngeneic CD19+ spleen cells (AgPCs) and stimulated with anti-CD3 (1 ng/ml). Proliferation was measured by CFSE dilution in CD4 T cells using flow cytometry after of 96 hr of culture. (A) Representative one-dimensional histograms of CFSE dilution from unstimulated (top) or from stimulated (bottom) WT, Nfatc2 KO and Tob1 KO T cells from one experiment using pooled spleen cells from 3 mice each. (B) Means ± S.D. of the percent of cells that underwent 0–7 divisions over 96 hr for each genotype. The data summarize 8, 4, and 3 experiments using triplicate samples of WT cells, Nfatc2 KO cells, and Tob1 KO cells, respectively, each with pooled cells from 2 or 3 mice.
Figure 5
Figure 5. Naïve T cells from Nfatc2 KO mice show the hyper-proliferative response phenotype.
CD4 T cells were isolated from single cell suspensions of spleens and lymph nodes from WT and Nfatc2 KO littermates by negative immunomagnetic selection. CD4+CD25CD44dim (naïve Tconv) cells were enriched by sorting to deplete CD4+CD25+ (Treg) and CD4+CD44bright (memory) cells. Naïve Tconv cells were labeled with CFSE, mixed 1∶1 with syngeneic AgPCs and stimulated with anti-CD3. Proliferation was measured by CFSE dilution in CD4 T cells using flow cytometry after of 96 hr of culture. (A) Representative one-dimensional histograms of CFSE dilution from unstimulated (top) or from stimulated (bottom) WT and Nfatc2 KO cells. Insets show two-dimensional contour plots of CD4 (y-axis) and CD44 (x-axis) expression. The box indicates the percent of CD4+CD44+ cells at the end of the culture period. (B) Means ± S.D. of the percent of cells in triplicate samples that underwent 0–7 divisions over 96 hr for each genotype from 2 experiments for each genotype.
Figure 6
Figure 6. Nfatc2 deficiency leads to enhanced proliferation in a lymphodepleted environment of homeostatic expansion, but does not provide improved survival fitness in a competitive lymphoreplete environment.
CD4+CD25 Tconvs were prepared as described from WT and from Nfatc2 KO mice. Sorted cells (100,000) were adoptively transferred into the tail vein of two B6.SCID (top) or two B6.CD45.1 (bottom) mice. Recipients were sacrificed 15 days later and total cell numbers recovered from spleens (SP) and lymph nodes (LN) were enumerated using a CellDyn 3500 hematology analyzer. The percent of donor cells in each recipient was then calculated based on the percent of CD4+CD45.2+ cells present in each preparation, and is represented by a symbol in the graphs. Lines indicate the mean for each recipient group.
Figure 7
Figure 7. Lymphocytic infiltrates into parenchymal organs and B-cell malignancies in Nfatc2 KO mice.
(A) Photomicrograph of a representative section from the parotid salivary gland of a 21-month old Nfatc2 KO mouse stained with H&E (magnification 100X) showing mild to moderate lymphocytic aggregates in the interstitium. Approximately 70% of the infiltrate consisted of B cells. (B) Photomicrograph of a representative section from lymph node of a 20-month old Nfatc2 KO mice stained with H&E (magnification 400X) showing effacement with corticomedullary architecture expanded by a homogenous population of large lymphocytes with large eccentric nuclei containing open to marginated chromatin, single to multiple prominent nucleoli, and scant to moderate amphophilic cytoplasm. The section contains scattered necrotic cells and 0–2 mitoses per high power field. The histological appearance is consistent with plasmablastic plasmacytoma. Similar tumors were identified in lymph nodes, livers, and spleens of Nfatc2 KO mice. (C and D) Immunohistochemical staining using antibodies against B220 (C) and CD3 (D) in serial sections from (B), showing the tumor is comprised by a monotonous population of malignant B cells with few residual T cells.
Figure 8
Figure 8. Incidence of lymphoma in Nfatc2 KO mice.
Seven of fifteen Nfatc2 KO mice (congenic generations 6–9 from heterozygous matings) that were allowed to reach 16 to 20 months of age (denoted by triangles/KO) developed B-cell malignancies. By comparison, none of 12 wild type or Nfatc2 age-matched hemizygous littermates (denoted by squares/WT) developed lymphoma.

Similar articles

Cited by

References

    1. Kiani A, Rao A, Aramburu J (2000) Manipulating immune responses with immunosuppressive agents that target NFAT. Immunity 12: 359–372. - PubMed
    1. Sundrud MS, Rao A (2007) New twists of T cell fate: control of T cell activation and tolerance by TGF-beta and NFAT. Curr Opin Immunol 19: 287–293. - PubMed
    1. Macian F, Lopez-Rodriguez C, Rao A (2001) Partners in transcription: NFAT and AP-1. Oncogene 20: 2476–2489. - PubMed
    1. Modiano JF, Johnson LD, Bellgrau D (2008) Negative regulators in homeostasis of naive peripheral T cells. Immunol Res 41: 137–153. - PMC - PubMed
    1. Muller MR, Rao A (2010) NFAT, immunity and cancer: a transcription factor comes of age. Nat Rev Immunol 10: 645–656. - PubMed

Publication types

MeSH terms