. 2014 Jun 19;10(6):e1003646.
doi: 10.1371/journal.pcbi.1003646. eCollection 2014 Jun.

Quantification of HTLV-1 clonality and TCR diversity

Affiliations

Quantification of HTLV-1 clonality and TCR diversity

Daniel J Laydon et al. PLoS Comput Biol. .

Abstract

Estimation of immunological and microbiological diversity is vital to our understanding of infection and the immune response. For instance, what is the diversity of the T cell repertoire? These questions are partially addressed by high-throughput sequencing techniques that enable identification of immunological and microbiological "species" in a sample. Estimators of the number of unseen species are needed to estimate population diversity from sample diversity. Here we test five widely used non-parametric estimators, and develop and validate a novel method, DivE, to estimate species richness and distribution. We used three independent datasets: (i) viral populations from subjects infected with human T-lymphotropic virus type 1; (ii) T cell antigen receptor clonotype repertoires; and (iii) microbial data from infant faecal samples. When applied to datasets with rarefaction curves that did not plateau, existing estimators systematically increased with sample size. In contrast, DivE consistently and accurately estimated diversity for all datasets. We identify conditions that limit the application of DivE. We also show that DivE can be used to accurately estimate the underlying population frequency distribution. We have developed a novel method that is significantly more accurate than commonly used biodiversity estimators in microbiological and immunological populations.


Conflict of interest statement

The authors have declared that no competing interests exist.

Figures

Figure 1
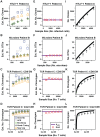
Figure 1. Outline of DivE species richness estimator.
DivE fits many models to rarefaction curves (black) and subsamples thereof (orange). Data is denoted by circles; fits by solid lines. Models are scored according to the following criteria: i) Discrepancy – mean percentage error between data points and model prediction; ii) Accuracy – error between full sample species richness (purple cross) and estimated species richness from subsample; iii) Similarity – area between subsample fit (orange) and full data fit (black); and iv) Plausibility – we require that S'(x) ≥0 and S"(x) ≤0. The best performing models are aggregated and extrapolated to estimate species richness. Model A performs poorly as criteria ii) and iii) are not satisfied. Model B performs well as all criteria are satisfied.
Figure 2
Figure 2. Outline of DivE distribution generation algorithm.
A Truncated species frequency distribution with x individuals distributed among y species. The frequency of species Si after sampling x individuals is denoted Fx(Si). B Species accumulation data generated from frequency distribution. C An aggregate of the best performing models as returned by DivE is used to extrapolate to point (x+a, y+1), where the next species is predicted. D Species Sy+1 is assigned a frequency of (1 - pmax)(x+a), where pmax is the maximum-likelihood proportion of individuals occupied by the y previously observed species. The remaining pmax(x+a) individuals are distributed among species S1, …, Sy in proportion to their observed relative frequencies at x. Steps C and D are repeated until the predicted species richness is reached. See Text S1 for further details.
Figure 3
Figure 3. Comparison of species richness estimators.
A–D The Chao1bc (blue), ACE (grey), Bootstrap (green), Good-Turing (black), and negative-exponential estimators (orange) are applied to in silico random subsamples of observed data. Examples for HTLV-1, microbial, and TCR data are shown. Estimates systematically increase with sample size in datasets where rarefaction curves do not plateau (e.g. in I, J, K). Where rarefaction curves do plateau (e.g. in L), estimates are consistent. E–H DivE (red) is applied to same subsamples as the other estimators. Performance of DivE was evaluated by comparing the error of estimates (Ŝobs), to the (known) number of species Sobs in the full observed data (purple line), i.e. error  = |Sobs - Ŝobs| /Sobs. In all datasets, DivE accurately estimates the species richness of the full observed data from subsamples of that data. I–L Corresponding HTLV-1, microbial and TCR rarefaction curves: arrows denote the size of the subsample to which each estimator was applied.
Figure 4
Figure 4. Comparison of estimators: Effect of sample size on estimated diversity.
Normalized gradients measuring proportional increase in estimated diversity against proportional increase in sample size. Normalized gradients (shown for each estimator and each patient data set in Table S1) were calculated by linear regression. For the HTLV-1 and microbial data, all estimators except DivE show large normalized gradients that are significantly positive. The TCR normalized gradients, though significantly positive, are small and do not show a substantial bias with sample size. *, **, and *** signify p<0.01, p<0.001, and p<0.0001 respectively; two-tailed binomial test (n = 14, 16, 20 for the HTLV-1, TCR and microbial data respectively).
Figure 5
Figure 5. Existing estimators underestimate diversity in HTLV-1 infection.
For HTLV-1 Patient D, three samples are pooled. Rarefaction curves from the pooled sample (black circles) and a subsample (red circles) are shown. Chao1bc, ACE, Bootstrap, Good-Turing and negative exponential estimates (blue, grey, green, black, and orange lines respectively) from the subsample, and DivE estimates (red cross) from the same subsample are plotted. Existing estimators produce a single estimate of diversity, and so their estimates are shown as lines. The diversity in the blood must be at least as great as that observed by pooling the samples. All existing estimators estimate the total diversity to be less than that observed. Given that the observed diversity is likely to be a small fraction of the total diversity this represents a considerable error. We used DivE to produce two estimates: the diversity in the pooled sample (i.e. in 15000 cells, red cross) and the total diversity of the blood. DivE accurately estimates the pooled sample species richness from the subsample, but also predicts higher values of species richness in the blood, consistent with the unseen clones implied by the pooled rarefaction curve. See Figure S3 for further examples.
Figure 6
Figure 6. Test of species richness estimators at different values of curvature parameter (Cp) using TCR data.
The curvature parameter Cp is plotted against the relative error (|Sobs - Ŝobs| /Sobs) of each estimator. Four patient data sets are shown: A total CD4+ from patient C; B total CD4+ from patient E; C total CD8+ from patient C; D total CD8+ from patient E. Each point represents an estimate from a subsample of data. Note the plots have different y-axis scales and the y-axes in C and D are segmented. Broadly, the accuracy of all estimators improves as Cp increases, and this increase is more pronounced for DivE. From Cp>0.1, DivE generally outperforms the existing estimators, but is prone to error at very low values of Cp., when the rarefaction curve implies a near-constant rate of species accumulation.
Figure 7
Figure 7. Validation of DivE distribution generation algorithm.
The DivE distribution generation algorithm (Figure 2) was applied to random samples (red dashed) of observed data (black solid). Accuracy was evaluated by comparing the estimated distribution (orange dashed) to the true distribution of the full observed data (black). Examples for HTLV-1 A, TCR B and microbial datasets C are shown.

References

    1. Wang GP, Sherrill-Mix SA, Chang K-M, Quince C, Bushman FD (2010) Hepatitis C virus transmission bottlenecks analyzed by deep sequencing. J Virol 84: 6218–6228. - PMC - PubMed
    1. Bimber BN, Burwitz BJ, O'Connor S, Detmer A, Gostick E, et al. (2009) Ultradeep pyrosequencing detects complex patterns of CD8+ T-lymphocyte escape in simian immunodeficiency virus-infected macaques. Journal of Virology 83: 8247–8253. - PMC - PubMed
    1. Messaoudi I, Patino JAG, Dyall R, LeMaoult J, Nikolich-, et al (2002) Direct link between MHC polymorphism, T cell avidity, and diversity in immune defense. Science 298: 1797–1800. - PubMed
    1. Davenport MP, Price DA, McMichael AJ (2007) The T cell repertoire in infection and vaccination: implications for control of persistent viruses. Current Opinion in Immunology 19: 294–300. - PubMed
    1. Siegrist C-A, Aspinall R (2009) B-cell responses to vaccination at the extremes of age. Nat Rev Immunol 9: 185–194. - PubMed

Publication types

Substances