. 2014 Jun 19;10(6):e1004368.
doi: 10.1371/journal.pgen.1004368. eCollection 2014 Jun.

Translational regulation of specific mRNAs controls feedback inhibition and survival during macrophage activation

Affiliations

Translational regulation of specific mRNAs controls feedback inhibition and survival during macrophage activation

Johanna Schott et al. PLoS Genet. .

Abstract

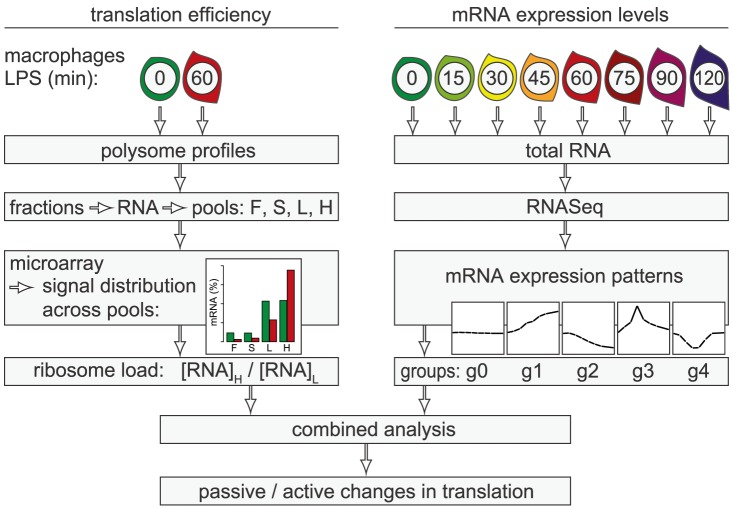
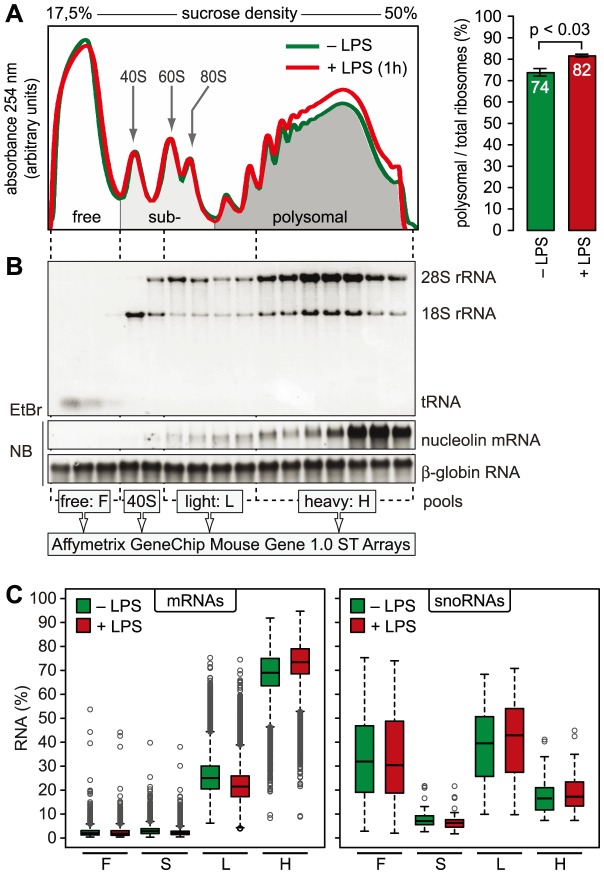
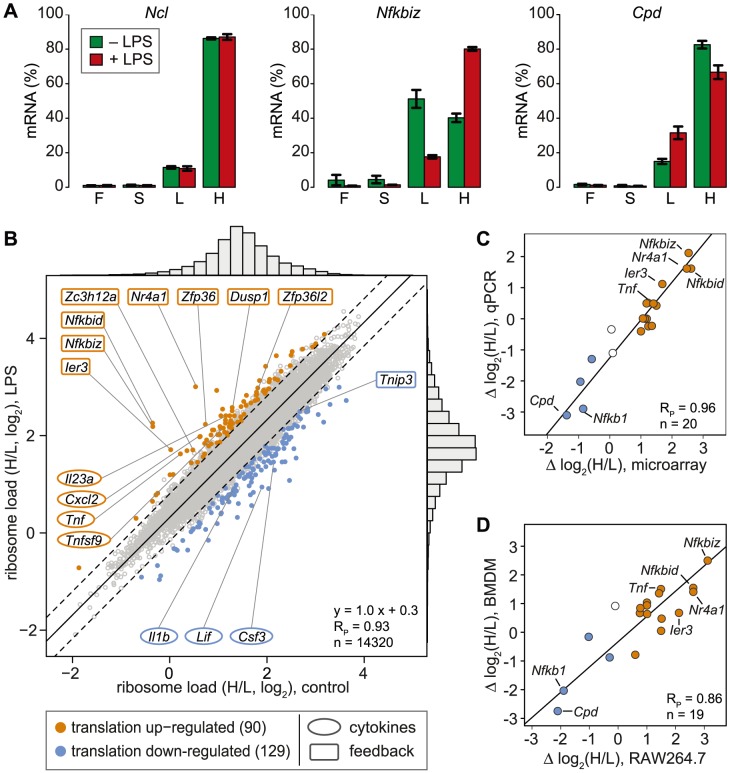
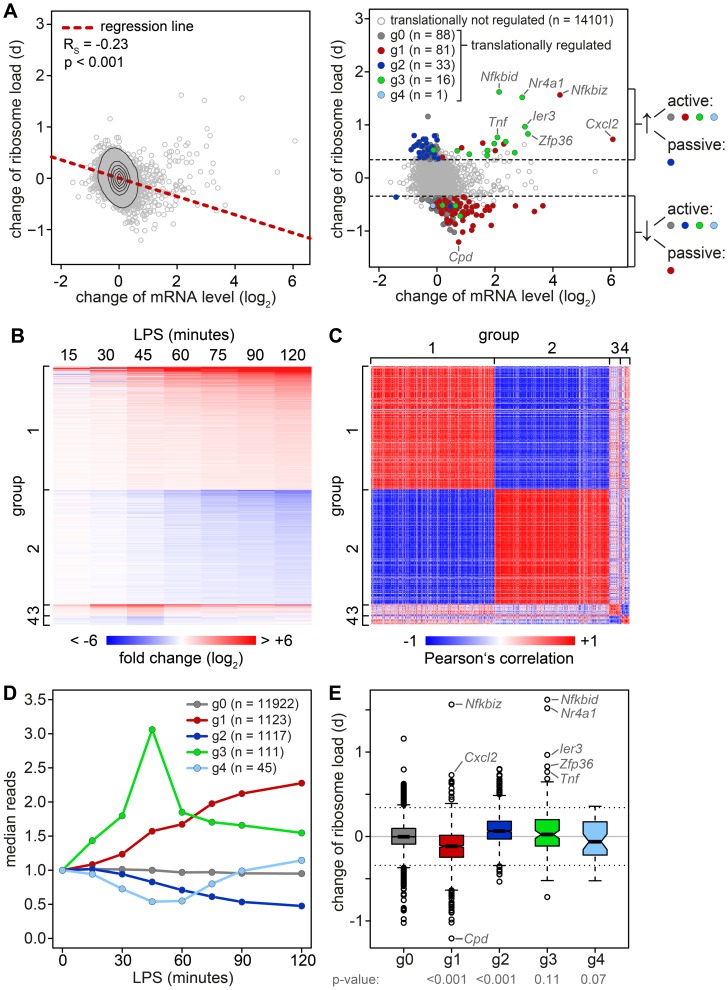
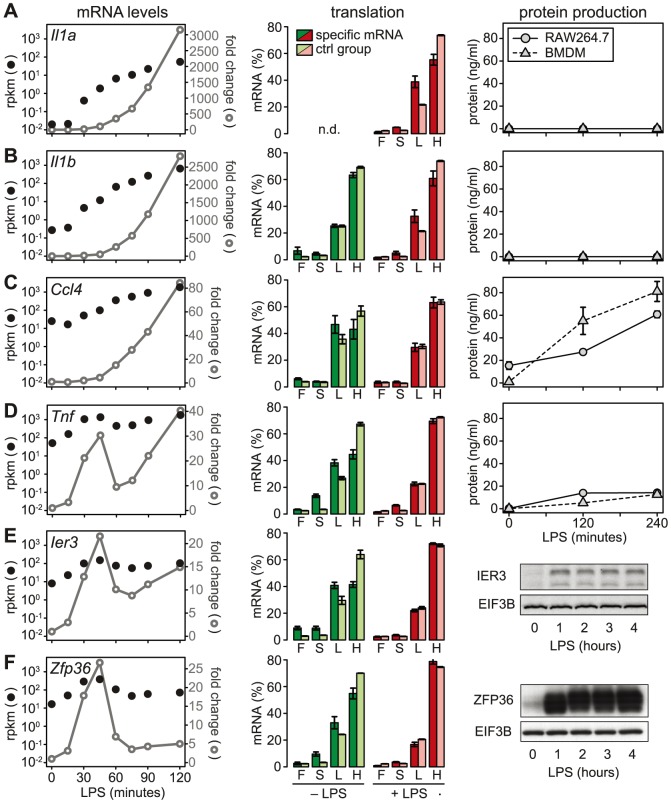
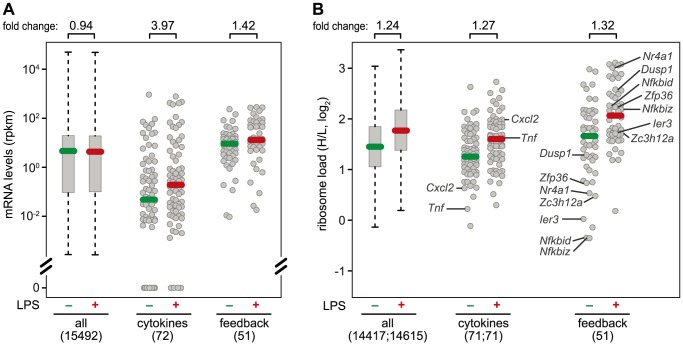
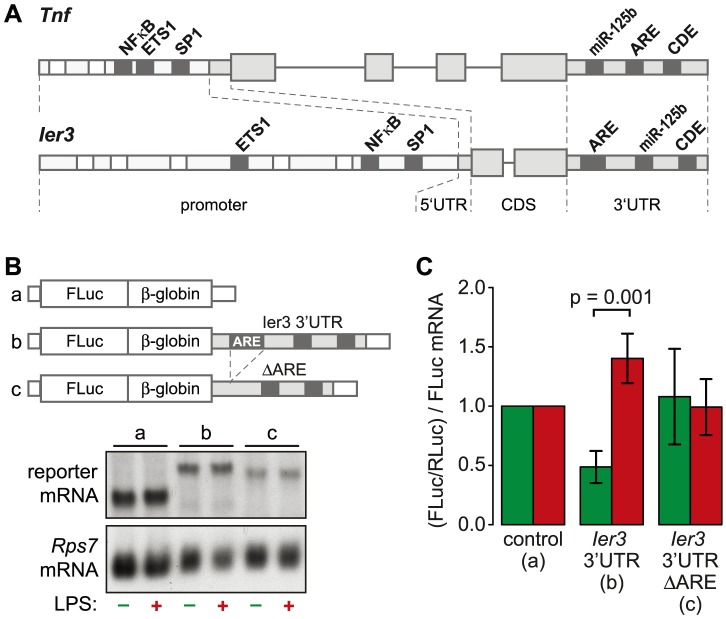
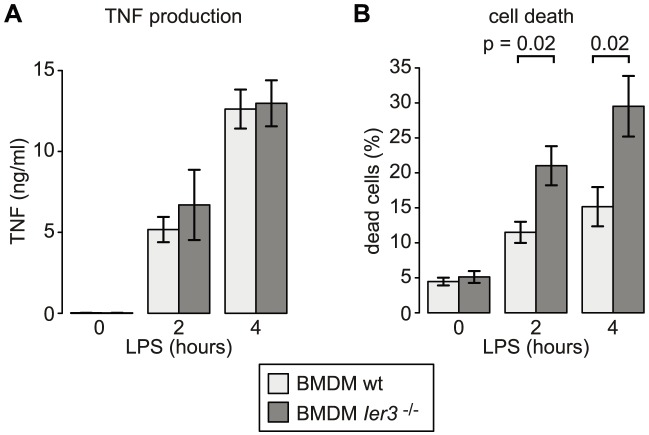
For a rapid induction and efficient resolution of the inflammatory response, gene expression in cells of the immune system is tightly regulated at the transcriptional and post-transcriptional level. The control of mRNA translation has emerged as an important determinant of protein levels, yet its role in macrophage activation is not well understood. We systematically analyzed the contribution of translational regulation to the early phase of the macrophage response by polysome fractionation from mouse macrophages stimulated with lipopolysaccharide (LPS). Individual mRNAs whose translation is specifically regulated during macrophage activation were identified by microarray analysis. Stimulation with LPS for 1 h caused translational activation of many feedback inhibitors of the inflammatory response including NF-κB inhibitors (Nfkbid, Nfkbiz, Nr4a1, Ier3), a p38 MAPK antagonist (Dusp1) and post-transcriptional suppressors of cytokine expression (Zfp36 and Zc3h12a). Our analysis showed that their translation is repressed in resting and de-repressed in activated macrophages. Quantification of mRNA levels at a high temporal resolution by RNASeq allowed us to define groups with different expression patterns. Thereby, we were able to distinguish mRNAs whose translation is actively regulated from mRNAs whose polysomal shifts are due to changes in mRNA levels. Active up-regulation of translation was associated with a higher content in AU-rich elements (AREs). For one example, Ier3 mRNA, we show that repression in resting cells as well as de-repression after stimulation depends on the ARE. Bone-marrow derived macrophages from Ier3 knockout mice showed reduced survival upon activation, indicating that IER3 induction protects macrophages from LPS-induced cell death. Taken together, our analysis reveals that translational control during macrophage activation is important for cellular survival as well as the expression of anti-inflammatory feedback inhibitors that promote the resolution of inflammation.


Conflict of interest statement

The authors have declared that no competing interests exist.

Figures

Figure 1
Figure 1. Work flow for the combined analysis of translation efficiency and mRNA expression patterns.
Polysome association of mRNAs was measured by sucrose density gradient fractionation and microarray analysis of four pools (F: free, S: 40S-associated, L: light polysomes, H: heavy polysomes). For each mRNA, the distribution across the pools was calculated. The ratio H/L was used as a measure for ribosome load. mRNA levels were quantified by RNASeq at a high temporal resolution and grouped into five distinct patterns (g0–g4). By combining both data sets, mRNAs whose translation is actively regulated can be distinguished from mRNAs with passive changes in translation.
Figure 2
Figure 2. Global translation in LPS-activated macrophages.
(A) Representative polysome profiles obtained by sucrose density gradient centrifugation from RAW264.7 macrophages before and after stimulation with LPS (100 ng/ml) for 1 h. Right panel: the percentage of polysomal ribosomes (mean ± SD, n = 8 for control and 3 for 1 h LPS) was calculated by quantifying the area under polysome profile curves. (B) Quality and distribution of RNA purified from 16 fractions after sucrose density gradient centrifugation. In vitro transcribed rabbit HBB2 (β-globin) RNA was added as a spike-in control for equal purification efficiency; EtBr, ethidium bromide; NB, Northern blot. RNA fractions were pooled as indicated and quantified with Affymetrix Mouse Gene 1.0 ST Arrays. (C) Box plot showing the mean distribution of mRNAs and snoRNAs in the four pools as determined by microarray analysis (n = 3).
Figure 3
Figure 3. Change of translation of individual mRNAs in LPS-activated macrophages.
(A) Distribution of Ncl, Nfkbiz and Cpd mRNA across the four pools of polysome fractions as determined by microarray analysis (mean ± SD, n = 3). (B) The ribosome load is defined as the ratio (H/L) of the proportion of an mRNA in the heavy (H) and the light (L) pool. Mean H/L was determined for each detectable, coding and RefSeq-annotated mRNA by microarray analysis (n = 3). Highlighted in orange or blue are all mRNAs that show a shift from the general trend (orthogonal regression, solid black line) beyond the cut-off of two SD (dashed lines) in ≥2/3 biological replicates and the mean; RP, Pearson's correlation coefficient. (C) The difference in ribosome load before and after LPS stimulation of RAW264.7 macrophages (Δ log2(H/L)) was determined for 20 mRNAs by microarray analysis (n = 3) and qPCR (n = 4). (D) The difference in ribosome load before and after LPS stimulation (Δ log2(H/L)) was determined for 19 mRNAs by qPCR in RAW264.7 cells (n = 4) and BMDM (n = 2).
Figure 4
Figure 4. Relation between changes in mRNA levels and changes in translation.
(A) Left panel: Change of translation d (orthogonal distance from the regression line in Figure 3B) versus change of mRNA levels in RAW264.7 macrophages after 1 h of LPS treatment as quantified by microarray (n = 3). Right panel: Change of translation d versus change of mRNA levels, color-coded according to groups determined by RNASeq. (B) Groups of mRNAs with different response patterns during activation of RAW264.7 macrophages, as determined by RNASeq (n = 1). g1 and g2 contain mRNAs with a first significant maximum or minimum, respectively, at or after 1 h of LPS treatment (p<0.05 and log2(fold change) >0.5 or <0.5). g3 and g4 contain mRNAs with one significant maximum or minimum, respectively, before 1 h. Fold changes (log2) to the control are represented by the intensity of blue (negative) or red (positive). (C) Pair-wise Pearson's correlation coefficient of all mRNAs in g1–4. The strength of correlation is represented by the intensity of blue (negative) or red (positive). (D) mRNA expression patterns of the groups g0–4 as median counts normalized to the median of the control condition. g0 contains all mRNAs that do not show a significant change. (E) Box plot showing the change of translation d for each of the groups; p-values were determined by two-sided Wilcoxon rank sum test.
Figure 5
Figure 5. ARE scores and different patterns of regulation.
(A) ARE scores were determined using the AREScore algorithm and represented as boxplot for the groups g0–g4 (as defined in Figure 4); p-values were determined by two-sided Wilcoxon rank sum test. (B) Boxplot of ARE scores for groups of mRNAs with active and passive changes in ribosome load as defined in Figure 4A; p-values were determined by two-sided Wilcoxon rank sum test.
Figure 6
Figure 6. LPS-induced changes in mRNA levels, translation and protein production.
(A–F) mRNA levels, polysome association and protein levels are shown for four cytokines (IL1A, IL1B, CCL4 and TNF) and two feedback inhibitors (IER3 and ZFP36). Left: mRNA levels in RAW264.7 macrophages were quantified by RNASeq (n = 1); shown are absolute expression values as reads per kilobase per million reads (rpkm) and fold change relative to the 0 minute time point. Middle: Translation in RAW264.7 macrophages was assessed by polysome fractionation and microarrays (n = 3); association of the mRNA with the free (F), 40S-bound (S), light (L) and heavy (H) pools is depicted next to the mean association of the control group of mRNAs with a similar ORF length ±25 nt. Right: Protein production by RAW264.7 macrophages or BMDM was determined by (A–D) flow cytometry (n = 3 for RAW264.7 cells, n = 4 for BMDM) or (E–F, from RAW264.7 macrophages) Western blotting (showing one representative example).
Figure 7
Figure 7. mRNA levels and translation of cytokines and feedback inhibitors.
(A) Absolute mRNA expression levels were measured by RNASeq (n = 1) and depicted as rpkm before and 1 h after LPS treatment of RAW264.7 macrophages for all genes with at least one read in one of the conditions (box plot), and the subgroups of cytokines and feedback inhibitors (dot plots). Among the cytokines, 18 genes had an rpkm value of 0 before stimulation, and 4 after stimulation. (B) Ribosome load (H/L) as determined in Figure 3 for all mRNAs detectable before or 1 h after LPS treatment of RAW264.7 macrophages, separately for all genes (box plot), cytokines and feedback inhibitors (dot blots). Translationally de-repressed cytokines and feedback inhibitors are labeled.
Figure 8
Figure 8. Translational regulation by the Ier3 3′UTR.
(A) Diagram depicting the similarity of regulatory motifs between the Ier3 and Tnf genes. Shared transcriptional and post-transcriptional elements are highlighted. (B) HEK-Blue mTLR4 cells were transiently co-transfected with different Firefly Luciferase reporter genes together with a Renilla Luciferase expressing plasmid. Firefly Luciferase reporter genes contained either the rabbit β-globin (HBB2) 3′UTR alone, the complete Ier3 3′UTR or the Ier3 3′UTR without the ARE. (C) To determine the relative translation efficiency, Firefly Luciferase (FLuc) activity was normalized to Renilla Luciferase (RLuc) activity and to the Firefly Luciferase reporter mRNA level as determined by Northern blot analysis. Bars represent mean values ± SEM (n = 4).
Figure 9
Figure 9. Effect of Ier3 knockout on TNF production and survival of LPS-stimulated BMDM.
(A) TNF secretion by wild type and Ier3 knockout BMDM was measured using a bead-based flow cytometry assay. Mean values ± SEM were determined from four experiments using BMDM of two different pairs of wild type and knockout mice. (B) Cell death was measured after propidium iodide and Annexin V staining by flow cytometry. Depicted is the mean percentage of double positive cells (± SEM) based on five experiments using BMDM from three different pairs of wild type/knockout mice.

References

    1. Falvo JV, Tsytsykova AV, Goldfeld AE (2010) Transcriptional control of the TNF gene. Curr Dir Autoimmun 11: 27–60. - PMC - PubMed
    1. Stamou P, Kontoyiannis DL (2010) Posttranscriptional regulation of TNF mRNA: a paradigm of signal-dependent mRNA utilization and its relevance to pathology. Curr Dir Autoimmun 11: 61–79. - PubMed
    1. Schott J, Stoecklin G (2010) Networks controlling mRNA decay in the immune system. Wiley Interdiscip Rev RNA 1: 432–456. - PubMed
    1. Piecyk M, Wax S, Beck AR, Kedersha N, Gupta M, et al. (2000) TIA-1 is a translational silencer that selectively regulates the expression of TNF-alpha. EMBO J 19: 4154–4163. - PMC - PubMed
    1. Garnon J, Lachance C, Di Marco S, Hel Z, Marion D, et al. (2005) Fragile X-related protein FXR1P regulates proinflammatory cytokine tumor necrosis factor expression at the post-transcriptional level. J Biol Chem 280: 5750–5763. - PubMed

Publication types

MeSH terms