

An expanded Notch-Delta model exhibiting long-range patterning and incorporating MicroRNA regulation
- PMID: 24945987
- PMCID: PMC4063677
- DOI: 10.1371/journal.pcbi.1003655
An expanded Notch-Delta model exhibiting long-range patterning and incorporating MicroRNA regulation
Abstract
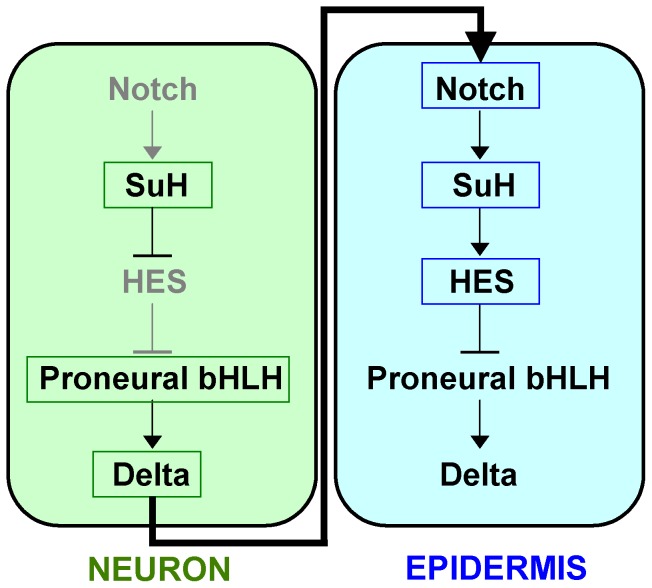
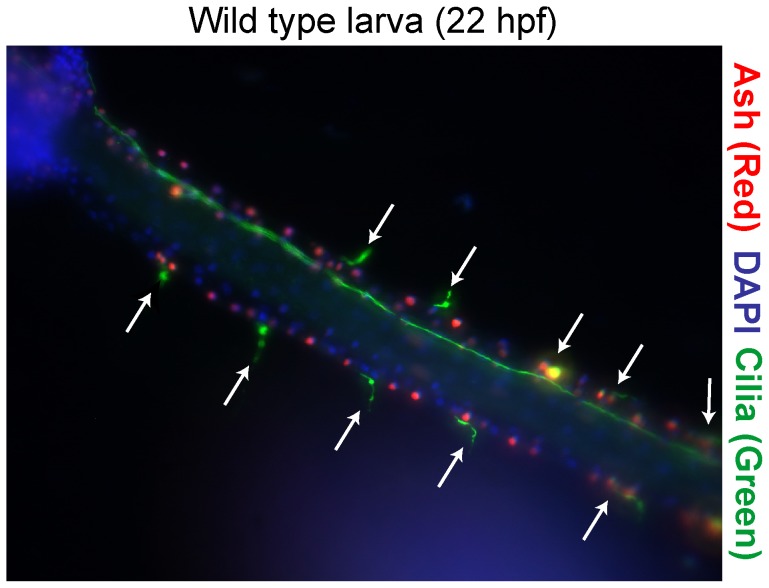
Notch-Delta signaling is a fundamental cell-cell communication mechanism that governs the differentiation of many cell types. Most existing mathematical models of Notch-Delta signaling are based on a feedback loop between Notch and Delta leading to lateral inhibition of neighboring cells. These models result in a checkerboard spatial pattern whereby adjacent cells express opposing levels of Notch and Delta, leading to alternate cell fates. However, a growing body of biological evidence suggests that Notch-Delta signaling produces other patterns that are not checkerboard, and therefore a new model is needed. Here, we present an expanded Notch-Delta model that builds upon previous models, adding a local Notch activity gradient, which affects long-range patterning, and the activity of a regulatory microRNA. This model is motivated by our experiments in the ascidian Ciona intestinalis showing that the peripheral sensory neurons, whose specification is in part regulated by the coordinate activity of Notch-Delta signaling and the microRNA miR-124, exhibit a sparse spatial pattern whereby consecutive neurons may be spaced over a dozen cells apart. We perform rigorous stability and bifurcation analyses, and demonstrate that our model is able to accurately explain and reproduce the neuronal pattern in Ciona. Using Monte Carlo simulations of our model along with miR-124 transgene over-expression assays, we demonstrate that the activity of miR-124 can be incorporated into the Notch decay rate parameter of our model. Finally, we motivate the general applicability of our model to Notch-Delta signaling in other animals by providing evidence that microRNAs regulate Notch-Delta signaling in analogous cell types in other organisms, and by discussing evidence in other organisms of sparse spatial patterns in tissues where Notch-Delta signaling is active.
Conflict of interest statement
The authors have declared that no competing interests exist.
Figures
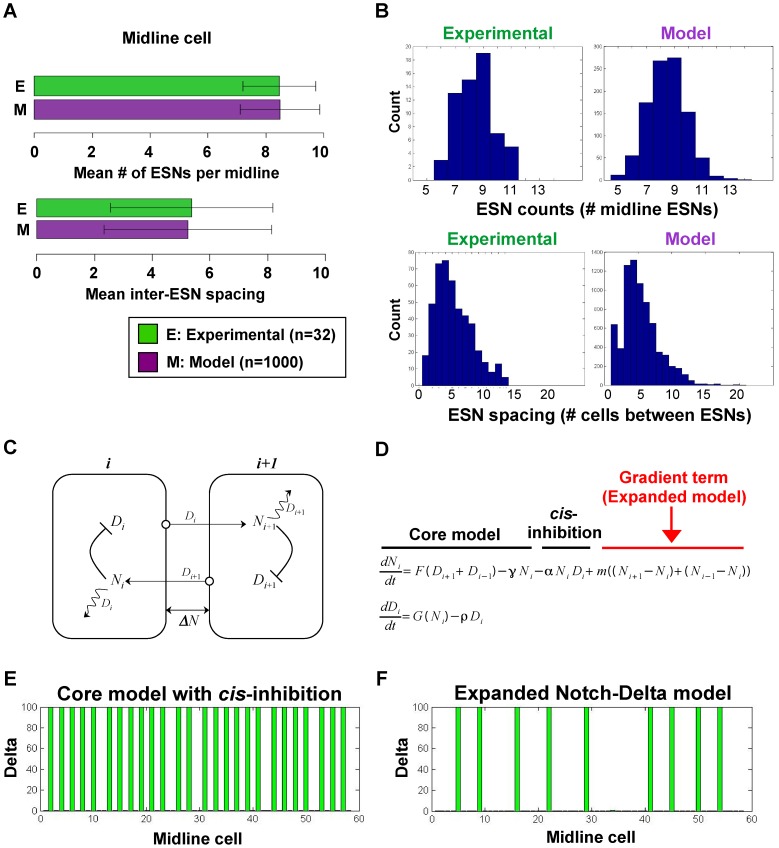
 , with addition of a Notch activity gradient term indicated in red. (E–F) Shown are the equilibrium values of Delta after a typical run of our expanded model in comparison with the original core model , .
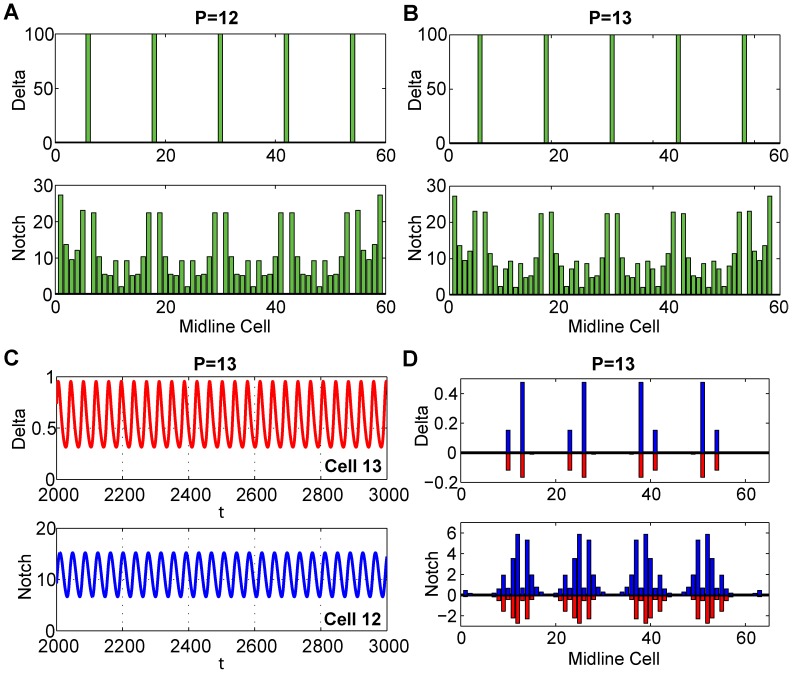
 and show the time varying oscillations (left) of Cell 13 for
  and Cell 12 for
  and the variation from the equilibrium for all cells (right).
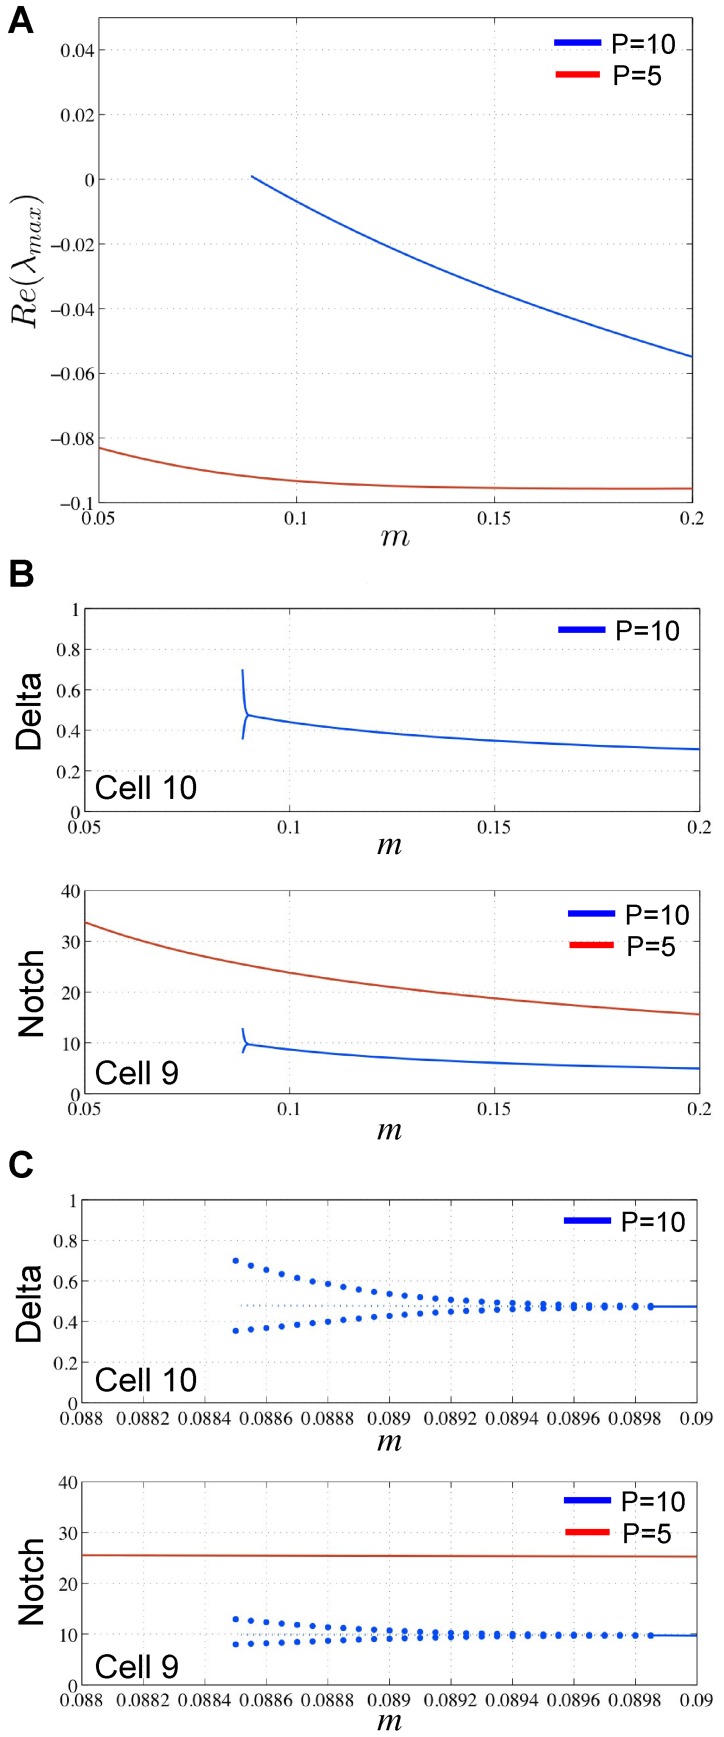
 for
for  (blue) and
  as
as  varies. (B) The equilibrium levels of Delta (top) and Notch (bottom) for our cases
  (blue) and
  as
as  varies. (C) Extreme close-up of the graph in (B), showing the supercritical Hopf bifurcation with the stable oscillating periodic orbit.
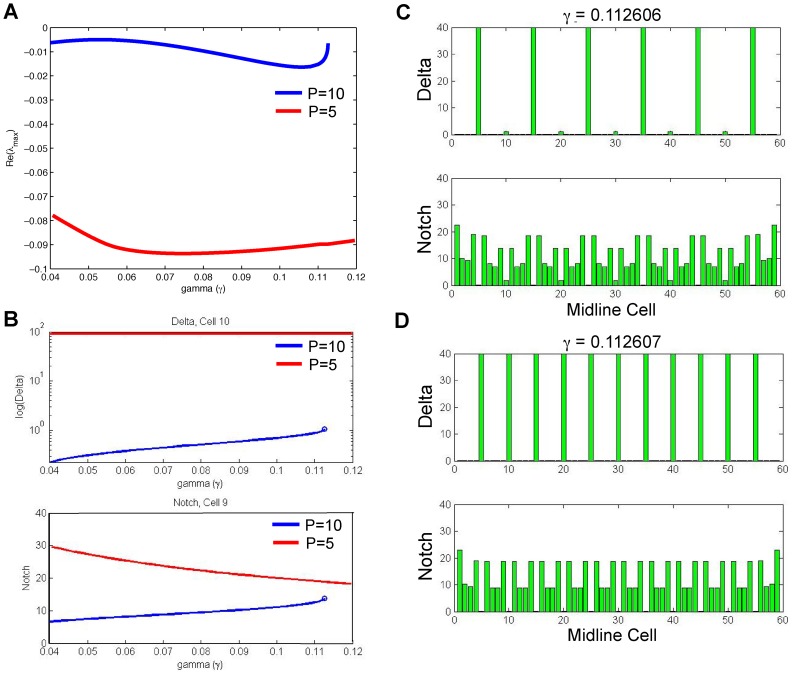
 for
for  (blue) and
  (red) as
  varies. (B) Equilibrium levels of Delta (top) and Notch (bottom) for our cases
  (blue) and
  (red) as
  varies. Note that Delta is shown as a semilog-y plot to show the change in Delta. (C–D) Equilibrium levels for Delta and Notch across all midline cells as we cross
  .
.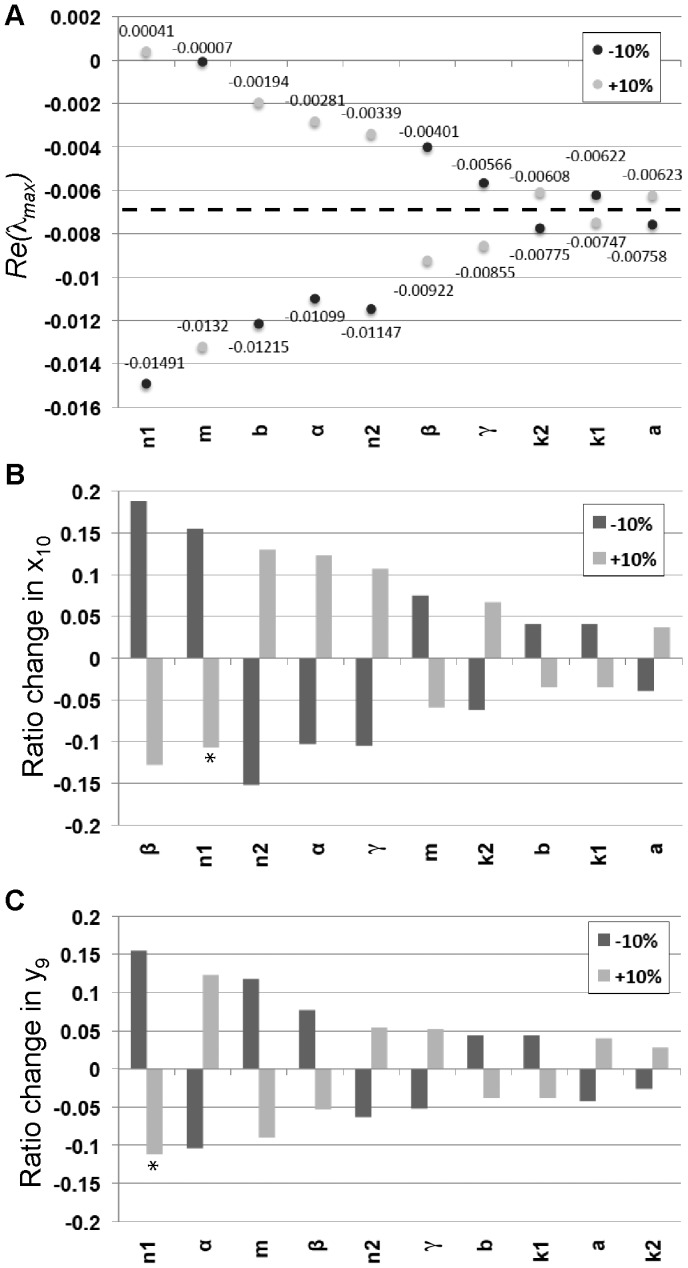
 are shown for all the parameters of the model with variations of
  % in each of the parameters. The ordering of the parameters shows which parameters had the largest increase in the eigenvalues for either a
  % change with the largest on the left. The dotted line indicates the value of
  for the original set of parameters used in Table 1. (B) The change in equilibrium value for
  after
after  % change in parameter values. The y-axis shows the ratio change of the equilibrium with the new parameter value divided by the original equilibrium value
  . The ordering of the parameters shows which parameters had the largest increase in the magnitude of
  for either a
  % change with the largest increase on the left. Since the equilibrium is unstable for
  ,
,  oscillates 17% above and 14% below the equilibrium marked with a
  . (C) The change in equilibrium value for
  after
after  % change in parameter values. The y-axis shows the ratio change of the equilibrium with the new parameter value divided by the original equilibrium value
  . The ordering of the parameters shows which parameters had the largest increase in the magnitude of
  for either a
  % change with the largest increase on the left. Since the equilibrium is unstable for
  ,
,  oscillates 13% above and 10% below the equilibrium marked with a
  .
.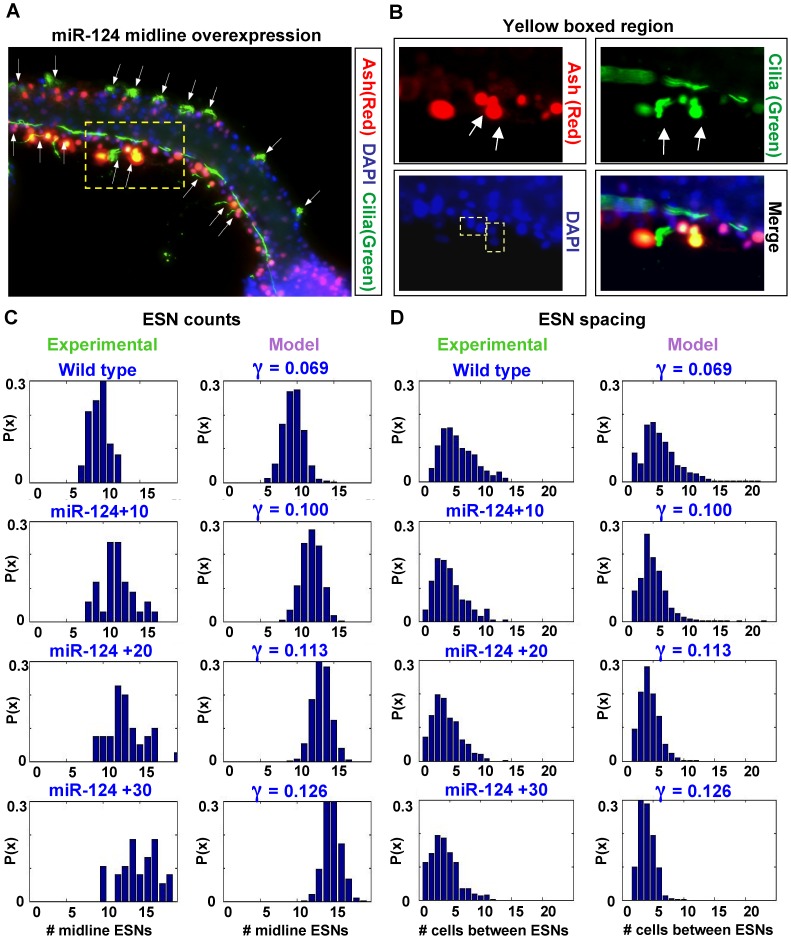
 , is modulated by miR-124.
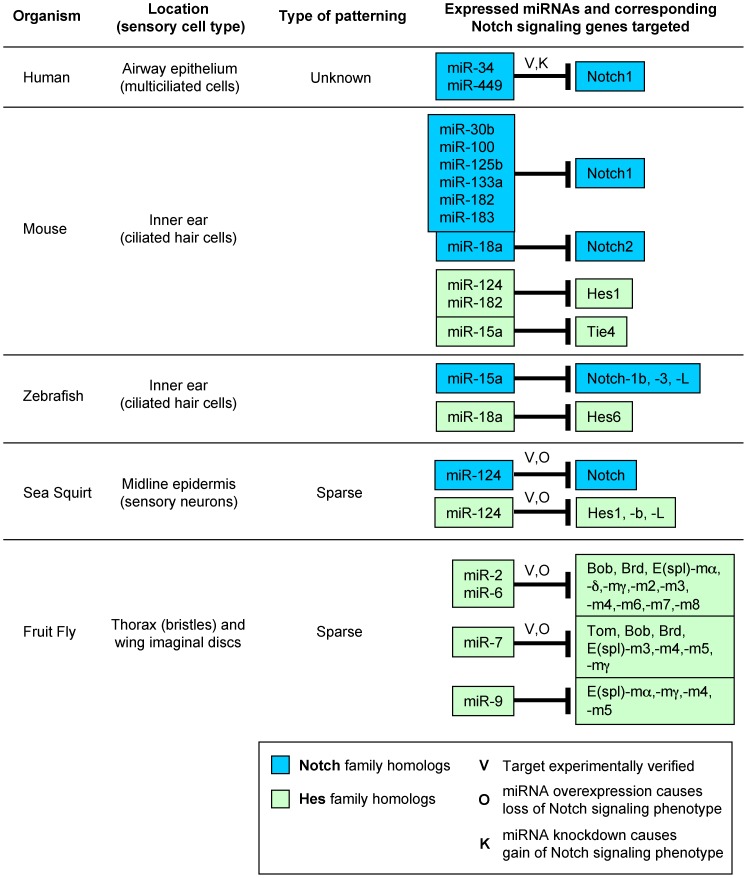
 UTRs of Notch and Hes homologs were found using our previously described target prediction algorithm . Some of these targets have been experimentally verified (V) (human: ; sea squirt: ; fruit fly: [9]). In Drosophila, miR-2, miR-6 and miR-7 overexpression (O) have all been previously shown to cause a phenotype indicative of suppressed Notch signaling activity and loss of lateral inhibition, such as increased density or clustering of microchaetes . In human airway epithelial tissue, knockdown (K) of miR-449 has been shown to cause a decreased rate of ciliated cells indicative of Notch signaling gain-of-function .
References
-
- Andersson ER, Sandberg R, Lendahl U (2011) Notch signaling: simplicity in design, versatility in function. Development 138: 3593–3612. - PubMed
-
- Artavanis-Tsakonas S, Rand MD, Lake RJ (1999) Notch signaling: Cell fate control and signal integration in development. Science 284: 770–776. - PubMed
-
- Bray SJ (2006) Notch signalling: a simple pathway becomes complex. Nature Reviews Molecular Cell Biology 7: 678–689. - PubMed
-
- Lai EC (2004) Notch signaling: Control of cell communication and cell fate. Development 131: 965–973. - PubMed
-
- Bertrand N, Castro DS, Guillemot F (2002) Proneural genes and the specification of neural cell types. Nature Reviews Neuroscience 3: 517–530. - PubMed
Publication types
MeSH terms
Substances
LinkOut - more resources
Full Text Sources
Other Literature Sources
