. 2014 Aug;93(3):479-93.
doi: 10.1111/mmi.12674. Epub 2014 Jul 10.

Co-ordinated regulation of the extracytoplasmic stress factor, sigmaE, with other Escherichia coli sigma factors by (p)ppGpp and DksA may be achieved by specific regulation of individual holoenzymes

Affiliations

Co-ordinated regulation of the extracytoplasmic stress factor, sigmaE, with other Escherichia coli sigma factors by (p)ppGpp and DksA may be achieved by specific regulation of individual holoenzymes

Saumya Gopalkrishnan et al. Mol Microbiol. 2014 Aug.

Abstract

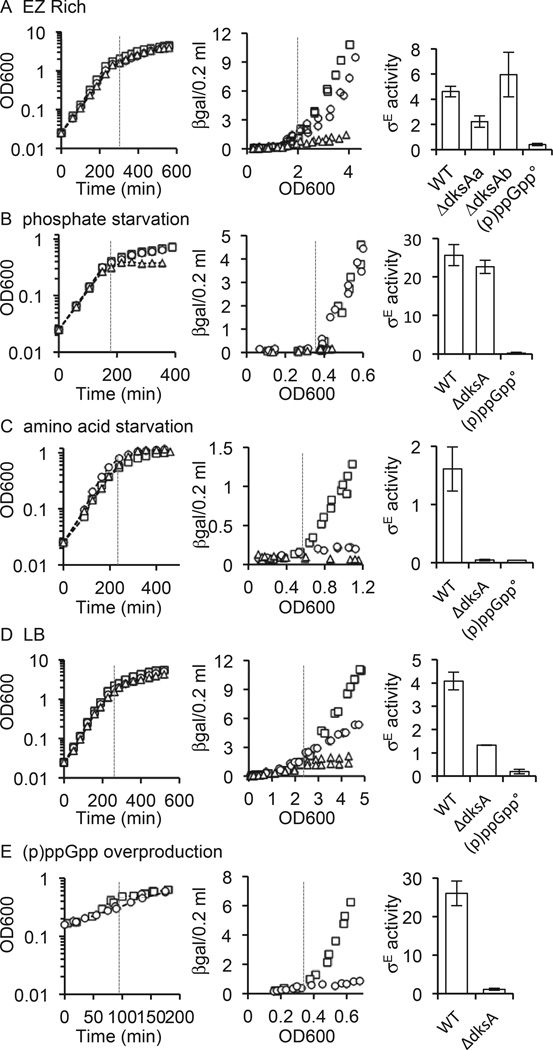
The E. coli alternative sigma factor, σ(E) , transcribes genes required to maintain the cell envelope and is activated by conditions that destabilize the envelope. σ(E) is also activated during entry into stationary phase in the absence of envelope stress by the alarmone (p)ppGpp. (p)ppGpp controls a large regulatory network, reducing expression of σ(70) -dependent genes required for rapid growth and activating σ(70) -dependent and alternative sigma factor-dependent genes required for stress survival. The DksA protein often potentiates the effects of (p)ppGpp. Here we examine regulation of σ(E) by (p)ppGpp and DksA following starvation for nutrients. We find that (p)ppGpp is required for increased σ(E) activity under all conditions tested, but the requirement for DksA varies. DksA is required during amino acid starvation, but is dispensable during phosphate starvation. In contrast, regulation of σ(S) is (p)ppGpp- and DksA-dependent under all conditions tested, while negative regulation of σ(70) is DksA- but not (p)ppGpp-dependent during phosphate starvation, yet requires both factors during amino acid starvation. These findings suggest that the mechanism of transcriptional regulation by (p)ppGpp and/or DksA cannot yet be explained by a unifying model and is specific to individual promoters, individual holoenzymes, and specific starvation conditions.


Figures

Fig. 1
Fig. 1
The increase in σE activity during entry into stationary phase is dependent on (p)ppGpp under all conditions, but dependent on dksA only under certain conditions. σE activity was measured throughout the growth curve in wild-type (squares), ΔdksA (circles) and (p)ppGpp0 (triangles) cultures grown in (A) EZ Rich, (B) EZ Rich with limiting phosphate (phosphate starvation), (C) EZ Rich with limiting isoleucine (amino acid starvation), (D) LB, and (E) following gratuitous production of (p)ppGpp in the absence of starvation. In E IPTG was added to cultures grown in LB at time 0 (OD600 = 0.15) to induce expression of relA′ and overproduction of (p)ppGpp. Growth curves are shown on the left. σE activity is shown in the right two graphs. The graphs in the middle are differential rate plots in which β-galactosidase activity from the σE-dependent reporter in fixed volume of culture is displayed as a function of culture growth throughout the growth curve. The dashed vertical lines on the left and middle graphs correspond to the OD600 after which σE activity increases. On the right, the increase in σE activity is quantified for each strain, as calculated from the slope on the differential rate plot for the points to the right of the dashed line. In EZ Rich, the increase in σE activity in the ΔdksA strain is biphasic, low during entry into stationary phase (OD600 = 2.0–3.5) then increasing at the end of the transition into stationary phase (OD600 = 3.5–4.5), and both slopes are quantified (ΔdksAa and ΔdksAb respectively). Data from at least two representative experiments are shown in each graph.
Fig. 2
Fig. 2
The increase in σS activity during entry into stationary phase is dependent on (p)ppGpp and dksA under all conditions tested. σS activity was measured from the bolA–lacZ fusion throughout the growth curve in wild-type, ΔdksA and (p)ppGpp0 cultures grown in (A) EZ Rich, (B) EZ Rich with limiting phosphate (phosphate starvation), (C) EZ Rich with limiting isoleucine (amino acid starvation), and (D) LB. The increase in σS activity when growth slows is quantified for each strain as described in Fig. 1.
Fig. 3
Fig. 3
DksA, but not ppGpp, is required for full inhibition of transcription from rrnB P1 by Eσ70 following phosphate depletion. A. Primer extension was used to measure mRNA production from the rrnB P1–lacZ fusion. The primer extension product is indicated by the closed arrowhead and a recovery marker by the open arrowhead. B. Growth curves of the reporter strains are shown on the right and the times at which samples were taken for primer extension are indicated.
Fig. 4
Fig. 4
σE activity increases following phosphate depletion independently of rseA. The ΔrseA strain was grown in EZ Rich (open squares) and EZ Rich with limiting phosphate (shaded squares). Growth curves are shown on the left and σE activity is shown on the right in a differential rate plot in which β-galactosidase from the σE-dependent reporter in 0.2 ml culture is displayed as a function of culture growth. The dashed vertical lines correspond to the OD600 after which σE activity increases in EZ Rich with limiting phosphate.
Fig. 5
Fig. 5
σE levels are similar in wild-type and (p)ppGpp0 strains following phosphate depletion. Wild-type and (p)ppGpp0 strains were grown in EZ Rich with limiting phosphate. A. Samples were taken at the indicated OD600 and cell extracts used for western blotting with an anti-σE polyclonal antibody. The band marked with an arrowhead corresponds to σE, while the top band is a cross-reacting band of unknown identity. B. Growth curves for the cultures from which samples were taken are shown. Comparable amounts of protein were loaded in each lane. The asterisk marks the point at which growth slows and cultures start to enter stationary phase.
Fig. 6
Fig. 6
(p)ppGpp levels increase and GTP, ATP and CTP levels decrease following phosphate starvation. A. Growth (inset graph) and σE activity (differential rate plot) from cultures used to isolate nucleotides are shown. Both graphs start with points after the shift to limiting phosphate (t = 0, OD600~0.15). B. TLC separation of nucleotides extracted with formic acid is shown for samples taken from cultures of WT, ΔdksA and (p)ppGpp0 strains at the indicated times after a shift to EZ Rich with limiting phosphate. C and D. (C) (p)ppGpp levels (arbitrary units, a.u.) were quantified from the TLC in part A and normalized to OD600 at the time of sampling or to (D) total (p)ppGpp and GTP pools. E. GTP, ATP and CTP levels normalized to the level at 15 min. in each of the three strains after a shift to low phosphate. Symbols are the same in all parts of the figure as indicated in the legend.
Fig. 7
Fig. 7
ppGpp accumulates to a greater extent than pppGpp following phosphate starvation in wild-type and ΔdksA strains. 1.5 M KH2PO4 was used as the running buffer in the TLC to resolve ppGpp from pppGpp. Extracts from a ppGpp0 strain and a strain overexpressing the relA′ fragment (pALS13) that accumulates both ppGpp and pppGpp are shown for reference.
Fig. 8
Fig. 8
σE activity increases independently of the source of (p)ppGpp in all strains that make (p)ppGpp following phosphate starvation. The indicated strains were grown in EZ Rich and shifted to EZ Rich with limiting phosphate at time 0. A and B. (A) σE activity measured when growth slows due to phosphate starvation is shown for each strain and (B) the corresponding growth curves are shown. C and D. (C) TLC separation of nucleotides and (D) quantification of (p)ppGpp levels (arbitrary units) normalized to OD600 at time of sampling after the shift to low phosphate are shown. E. (p)ppGpp levels normalized to total (p)ppGpp and GTP pools for wild-type, spoTsyn−, ΔrelA, ΔrelAspoThyd− strains. Symbols are the same in all parts of the figure as indicated in the legend.

Similar articles

Cited by

References

    1. Aberg A, Fernández-Vázquez J, Cabrer-Panes JD, Sánchez A, Balsalobre C. Similar and divergent effects of ppGpp and DksA deficiencies on transcription in Escherichia coli. J Bacteriol. 2009;191:3226–3236. - PMC - PubMed
    1. Ades SE, Connolly LE, Alba BM, Gross CA. The Escherichia coli sigma(E)-dependent extracytoplasmic stress response is controlled by the regulated proteolysis of an anti-sigma factor. Genes Dev. 1999;13:2449–2461. - PMC - PubMed
    1. Ades SE, Grigorova IL, Gross CA. Regulation of the alternative sigma factor sigma(E) during initiation, adaptation, and shutoff of the extracytoplasmic heat shock response in Escherichia coli. J Bacteriol. 2003;185:2512–2519. - PMC - PubMed
    1. Baba T, Ara T, Hasegawa M, Takai Y, Okumura Y, Baba M, et al. Construction of Escherichia coli K-12 in-frame, single-gene knockout mutants: the Keio collection. Mol Syst Biol. 2006;2:2006–2008. - PMC - PubMed
    1. Barchinger SE, Ades SE. Regulated proteolysis: control of the Escherichia coli σ(E)-dependent cell envelope stress response. Subcell Biochem. 2013;66:129–160. - PubMed

Publication types

MeSH terms

LinkOut - more resources