. 2014 Jun 19;5(6):e1296.
doi: 10.1038/cddis.2014.247.

Tissue-specific deregulation of selected HDACs characterizes ALS progression in mouse models: pharmacological characterization of SIRT1 and SIRT2 pathways

Affiliations

Tissue-specific deregulation of selected HDACs characterizes ALS progression in mouse models: pharmacological characterization of SIRT1 and SIRT2 pathways

C Valle et al. Cell Death Dis. .

Abstract

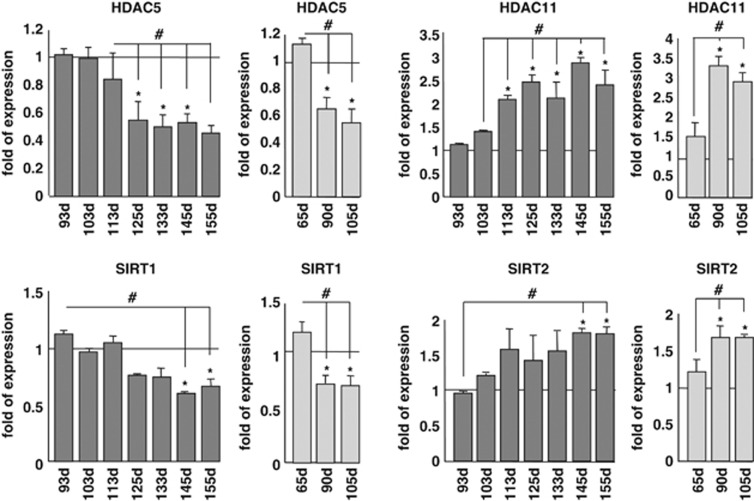
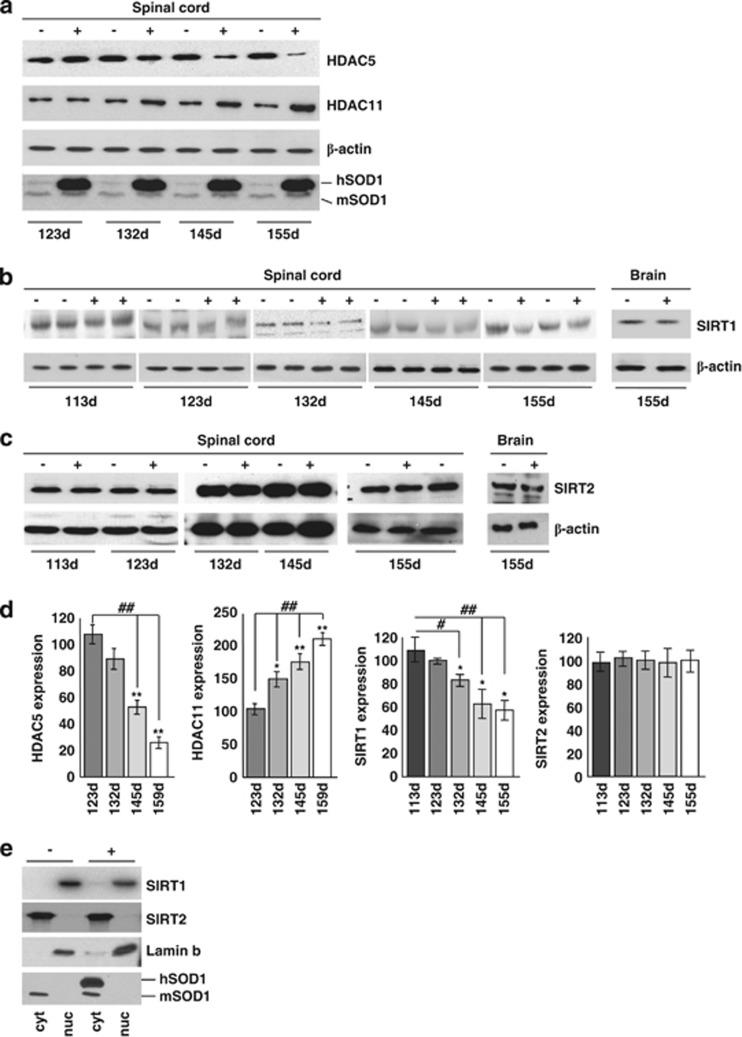
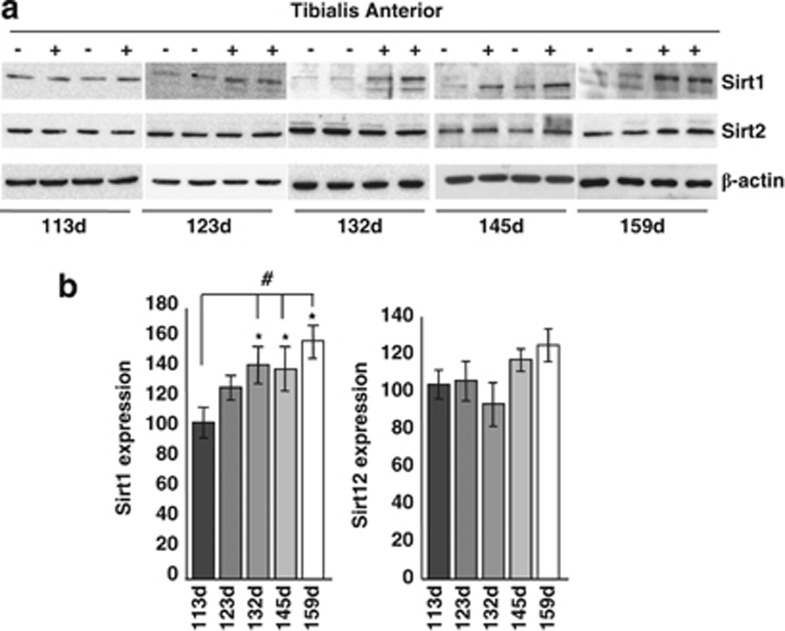
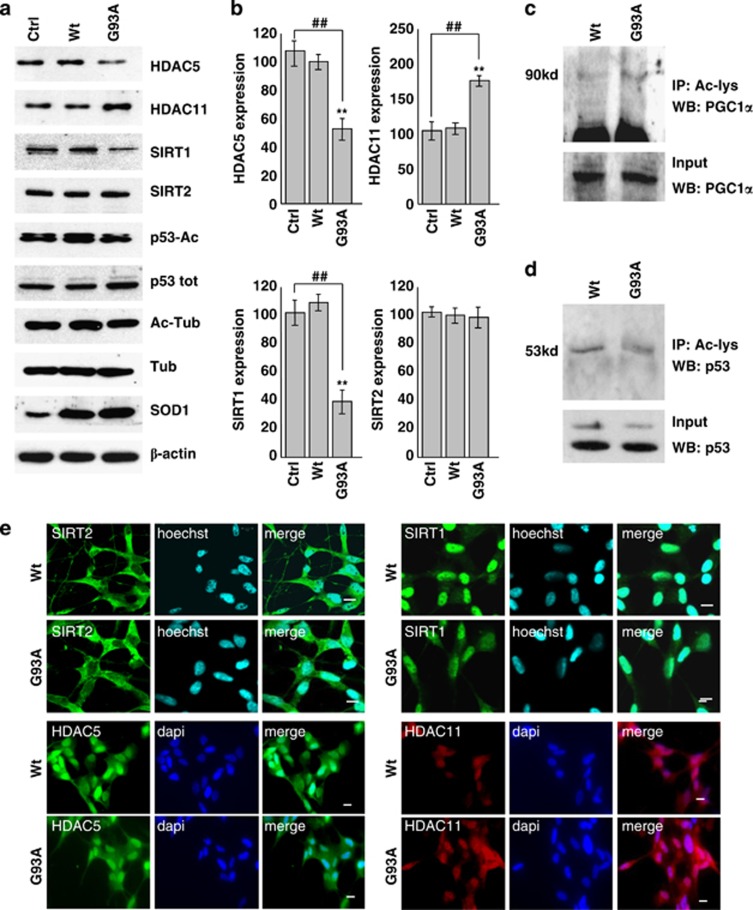
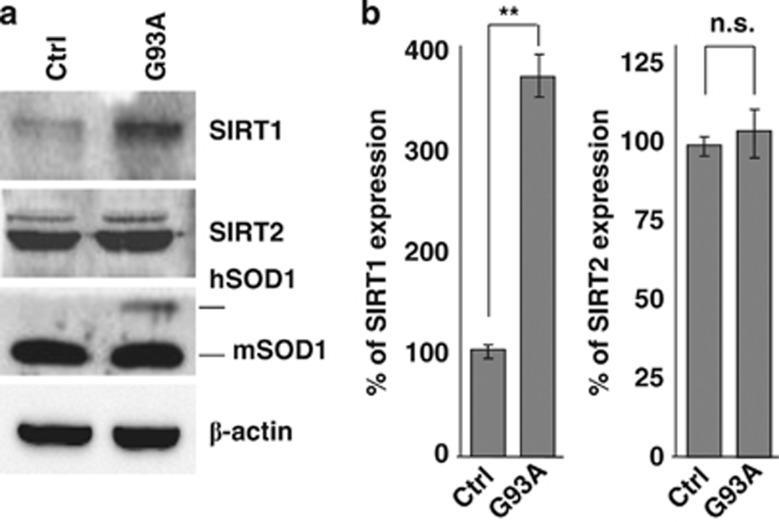
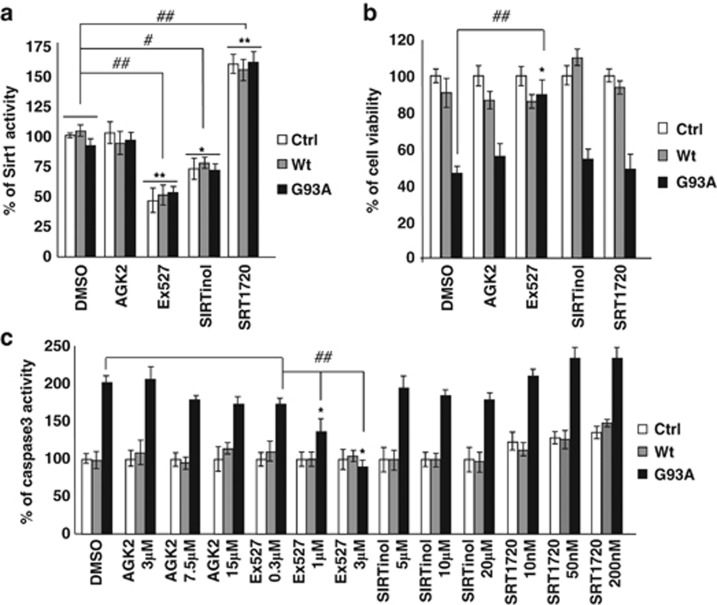
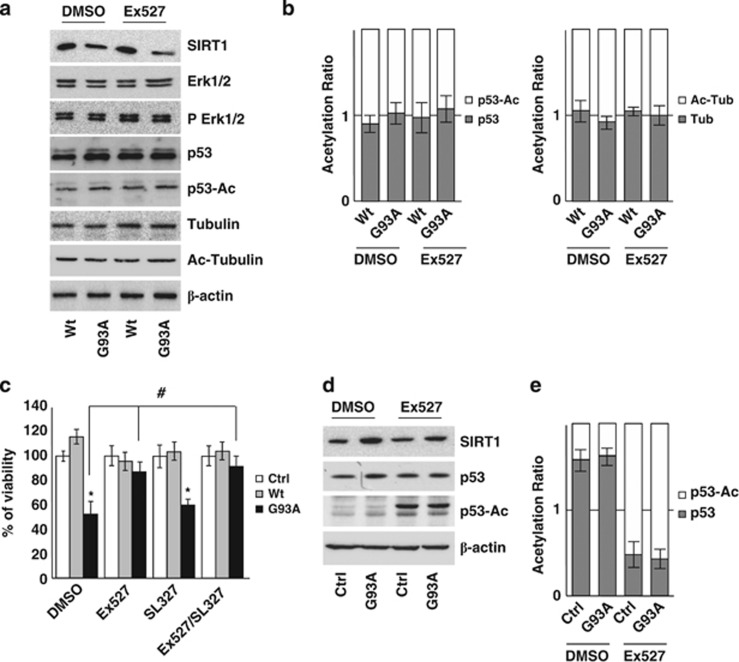
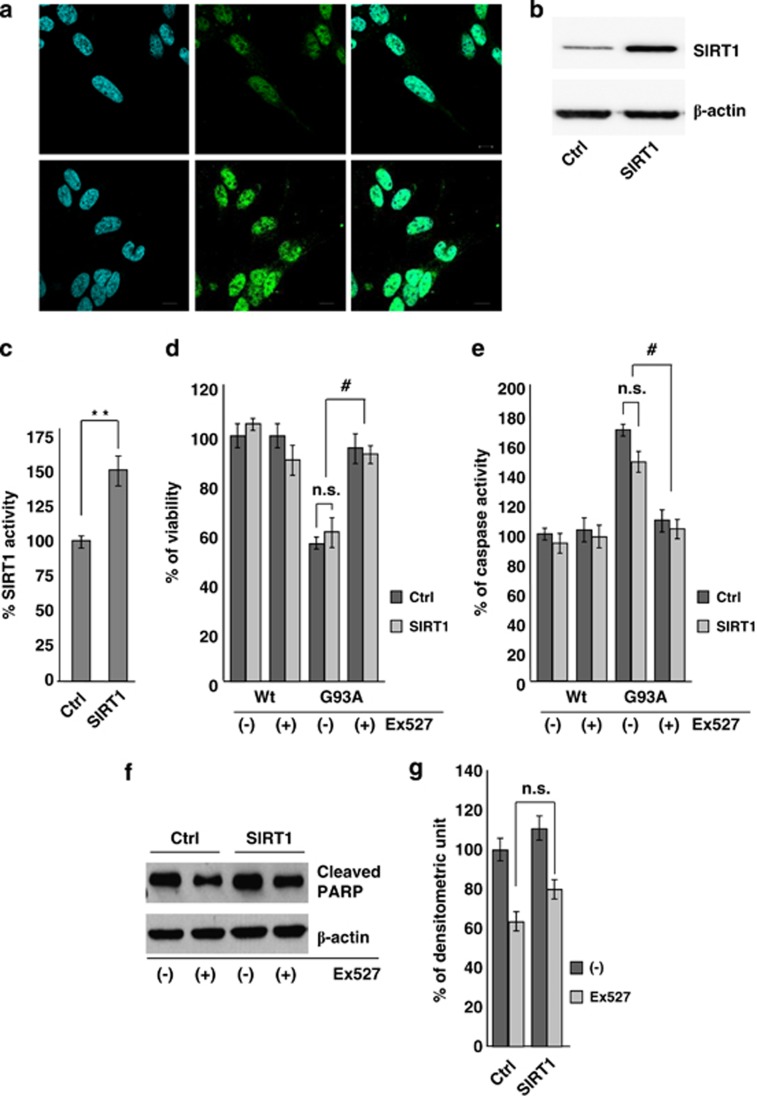
Acetylation homeostasis is thought to play a role in amyotrophic lateral sclerosis, and treatment with inhibitors of histone deacetylases has been considered a potential and attractive therapeutic approach, despite the lack of a thorough study of this class of proteins. In this study, we have considerably extended previous knowledge on the expression of 13 histone deacetylases in tissues (spinal cord and muscle) from mice carrying two different ALS-linked SOD1 mutations (G93A-SOD1 and G86R-SOD1). We have then focused on class III histone deacetylases SIRT1 and SIRT2 that are considered relevant in neurodegenerative diseases. SIRT1 decreases in the spinal cord, but increases in muscle during the progression of the disease, and a similar expression pattern is observed in the corresponding cell models (neuroblastoma and myoblasts). SIRT2 mRNA expression increases in the spinal cord in both G93A-SOD1 and G86R-SOD1 mice but protein expression is substantially unchanged in all the models examined. At variance with other sirtuin modulators (sirtinol, AGK2 and SRT1720), the well-known SIRT1 inhibitor Ex527 has positive effects on survival of neuronal cells expressing mutant SOD1, but this effect is neither mediated by SIRT1 inhibition nor by SIRT2 inhibition. These data call for caution in proposing sirtuin modulation as a target for treatment.


Figures

Figure 1
Figure 1
Expression of selected mRNAs coding for HDACs in the spinal cord of ALS mice. The cDNAs obtained from total RNA extracted from spinal cord of G93A-SOD1 (dark bars) and G86R-SOD1 (light bars) transgenic mice and their nontransgenic littermates were analyzed by quantitative RT-PCR to assess mRNA expression of HDAC5, HDAC11,SIRT1 and SIRT2. Analysis was performed at different stages of disease starting from early presymptomatic to end stage. The mRNA levels from control mice are set as 1. Results were obtained from at least three different mice from each stage and are expressed as the ratio between the average of values, normalized to the average values of two different housekeeping genes, from nontransgenic and transgenic mice. *P<0.05 with respect to nontransgenic mice of the same age; #P<0.05 with respect to presymptomatic or early symptomatic transgenic mice for G93A-SOD1 genotype, and with respect to presymptomatic or symptomatic transgenic mice for G86R-SOD1 genotype
Figure 2
Figure 2
HDAC protein expression in spinal cord of ALS mice. (a) Western blot analysis of 30 μg of total protein extract from spinal cord of transgenic (+) and nontransgenic (−) G93A-SOD1 mice from symptomatic (123d) to end stage (155d) of disease using antibodies against HDAC5 and HDAC11, β-actin as a loading control and SOD1 to confirm genotypes. hSOD1 indicates exogenous human SOD1, and mSOD1 is endogenous mouse SOD1. (b and c) Same as (a) but starting from early symptomatic stage of disease (113d) using antibodies against SIRT1 and SIRT2. Total brain protein extract was used to confirm tissue specificity. (d) Densitometric analysis of data from n=4 G93A-SOD1 and n=4 nontransgenic mice from different experiments. *P<0.05 and **P<0.01 with respect to nontransgenic mice of the same age; ##P<0.01 with respect to symptomatic transgenic mice. (e) Western blot analysis of cytosolic (cyt) and nuclear (nuc) protein extract from late symptomatic (145 days) G93A-SOD1 (G93A) and nontransgenic (−) mice using antibodies against SIRT1 and SIRT2. Fractions were controlled for the presence of the nuclear marker lamin B and the cytosolic marker SOD1
Figure 3
Figure 3
SIRT1 and SIRT2 expression in the muscle of G93A-SOD1 mice. (a) Western blot analysis of 20 μg of total protein extract from Tibialis anterior of transgenic (+) and nontransgenic (−) G93A-SOD1 mice from symptomatic (113d) to end stage (159d) of disease using antibodies against SIRT1 and SIRT2. β-Actin was used as loading control. (b) Densitometric analysis of n=4 G93A-SOD1 and n=4 nontransgenic mice from different experiments. Values significantly different from relative controls are indicated with *P<0.05 with respect to nontransgenic mice of the same age; #P<0.05 with respect to early symptomatic transgenic mice
Figure 4
Figure 4
Protein expression patterns of HDAC5, HDAC11, SIRT1 and SIRT2 in differentiated human SH-SY5Y neuroblastoma cells. SH-SY5Y cells were uninfected (Ctrl) or infected with adenoviral vectors coding for wild-type SOD1 (Wt) or G93A-SOD1 (G93A). (a) Western blot analysis of 20 μg of cell lysate using antibodies against HDAC5, HDAC11, SIRT1, SIRT2, p53-Ac and Ac-tubulin. β-Actin was used as loading control, SOD1 as infection control, and P-53 and tubulin to monitor the acetylation rate. (b) Densitometric analysis of n=3 experiments as in (a). Values significantly different from relative controls are indicated with **,##P<0.01. (c and d) Western blot analysis to detect PGC1α and p53 acetylation, respectively, in the immunoprecipitate with anti Ac-lysine antibody. In the lower panel, 5% of input is shown. (e) Immunolocalization of HDAC5, HDAC11, SIRT1 and SIRT2. Panels show typical images observed in n=3 independent experiments. Scale bar: 5 μm
Figure 5
Figure 5
Protein expression patterns of SIRT1 and SIRT2 in mouse myoblast C2C12 cells. Untransfected C2C12 (Ctrl) and C2C12 cells constitutively expressing G93A-SOD1 (G93A) were subjected to differentiation protocol to induce expression of the transgene under the myosin heavy chain promoter. (a) Western blot analysis of 20 μg protein from cells lysates obtained 5 days after differentiation of C2C12 cells expressing G93A-SOD1 (G93A) or untransfected (Ctrl) using antibodies against SIRT1 and SIRT2. SOD1 was used to control genotype, β-actin as loading control. (b) Densitometric analysis of n=3 experiments as in (a). Values significantly different from relative controls are indicated with **P<0.01; n.s. indicates values that do not differ significantly
Figure 6
Figure 6
Effect of SIRT1 and SIRT2 modulation in differentiated SH-SY5Y cells. (a) SIRT1 activity was measured by a fluorometric assay on 40 μg of total protein extract from either uninfected (Ctrl) and cells infected with adenoviral vectors coding for Wt-SOD1 (Wt) and G93A-SOD1 (G93A) treated with one of the following: 15 μM AGK2, 3 μM Ex527 and 20 μM SIRTinol that inhibit SIRT2, SIRT1 and both Sirtuins, respectively; and 10 nM SRT1720 that activates SIRT1. Activity is reported as percent of the relative uninfected DMSO-treated control and reported as the mean±S.D. of three independent experiments with each sample in triplicate. Values significantly different from relative controls are indicated with *P<0.05 and **P<0.01 with respect to Ctrl; and #P<0.05 and ##P<0.01 with respect to DMSO-treated cells. (b) SH-SY5Y cells either uninfected (Ctrl) or infected with adenoviral vectors coding for Wt-SOD1 (Wt) and G93A-SOD1 (G93A) were treated with 15 μM AGK2, 3 μM Ex527, 20 μM SIRTinol and 10 nM SRT1720. Cell viability was assessed by the MTS assay 48 h after infection and drug treatments. Absorbance at 490 nm are expressed as percent of the relative uninfected control cells and reported as the mean±S.D. of three independent experiments made in triplicate. Values significantly different from relative controls are indicated with *P<0.05 with respect to Ctrl and ## P<0.01 with respect to DMSO-treated cells. (c) Cells either uninfected (Ctrl) or infected with adenoviral vectors coding for Wt-SOD1 (Wt) and G93A-SOD1 (G93A) were treated with three increasing doses of AGK2, Ex527, SIRTinol or SRT1720. Cell protein extracts were assayed, 48 h after infection and drug treatment, for Caspase-3 activity by a fluorescence enzymatic assay and reported as percent of the relative uninfected control cells. Mean±S.D. of four independent experiments is given. Values significantly different from the relative controls are indicated with *P<0.05 with respect to Ctrl and ##P<0.01 with respect to DMSO-treated cells
Figure 7
Figure 7
G93A-SOD1 toxicity is not mediated by p53 acetylation state or by IRS-2/Ras/ERK1/2 pathway in SH-SY5Y cells. (a) Western blot analysis of 20 μM of total protein extract from cells infected with adenoviral vectors coding for Wt-SOD1 (Wt) and G93A-SOD1 (G93A) and treated with 3 μM Ex527 or DMSO. Antibodies against SIRT1, Erk1/2, pErk1/2, p53, p53-Ac, tubulin and Ac-tubulin were used. β-Actin was used as loading control. One representative blot is shown from three independent experiments giving comparable results. (b) Densitometric analysis of results as in (a); data are expressed as acetylation ratio of p53 and tubulin. (c) Cells infected with adenoviral vectors coding for Wt-SOD1 (Wt) and G93A-SOD1 (G93A) were treated with 3 μM Ex527 or with 3 μM SL327 or both. Cell viability was assessed and reported for Figure 5a. Values significantly different from relative controls are indicated with *P<0.05 with respect to Ctrl and #P<0.05 with respect to DMSO. (d) Western blot analysis of 20 μM of total protein extract from C2C12 cells differentiated for 5 days and expressing G93A-SOD1 (G93A) or untransfected (Ctrl). Antibodies against SIRT1, p53 and p53-Ac were used. β-Actin was used as loading control. One representative blot is shown from three independent experiments giving comparable results. (e) Densitometric analysis of data as in (d); data are expressed as acetylation ratio of p53
Figure 8
Figure 8
Constitutive overexpression of SIRT1 does not protect differentiated SH-SY5Y neuroblastoma cells from G93A-SOD1 toxicity. (a) Immunofluorescence analysis on SH-SY5Y cells untransfected or stably transfected for SIRT1 overexpression using antibodies against SIRT1. Scale bar: 10 μm. (b) Western blot analysis of 20 μg of total protein extract from cells either untransfected (Ctrl) or stably transfected for SIRT1 overexpression (SIRT1) using antibodies against SIRT1 and β-actin as a loading control. One representative blot from three independent experiments giving comparable results is shown. (c) SIRT1 activity was measured by a fluorometric assay on 40 μg of total protein extract from either untransfected (Ctrl) or stably transfected cells (SIRT1). Activity is reported as percent of control cells and as the mean±S.D. of three independent experiments with each sample done in triplicate. Values significantly different from relative controls are indicated with **P<0.01 with respect to Ctrl. (d) Cell viability of untransfected (Ctrl) and stably transfected (SIRT1) cells infected with adenoviral vectors coding for Wt-SOD1 (Wt) and G93A-SOD1 (G93A). Values are the mean±S.D. of three independent experiments in triplicate. Values that do not differ significantly are marked with n.s. (e) Total protein extracts from cells as in (d) and treated with 3 μM Ex527 were assayed after 48 h for Caspase-3 activity. Data are reported as the mean±S.D. of three independent experiments. Values that do not differ significantly with respect to the relative control are marked with n.s; #P<0.05 significantly different with respect to DMSO. (f) Western blot analysis of cleaved PARP in 20 μg of total protein extract from cells as in (d) and treated with DMSO (−) or 3 μM Ex527 (+). Antibodies against β- actin were used as loading control. One representative blot is shown from three independent experiments giving comparable results. (g) Densitometric analysis of n=4 experiments as in (f). n.s. indicates values that do not differ significantly

Similar articles

Cited by

References

    1. 1Cozzolino M, Pesaresi MG, Gerbino V, Grosskreutz J, Carrì MT. Amyotrophic lateral sclerosis: new insights into underlying molecular mechanisms and opportunities for therapeutic intervention. Antioxid Redox Signal 2012; 17: 1277–1330. - PubMed
    1. 2Schmalbach S, Petri S. Histone deacetylation and motor neuron degeneration. CNS Neurol Disord Drug Targets 2010; 9: 279–284. - PubMed
    1. 3Saha RN, Pahan K. HATs and HDACs in neurodegeneration: a tale of disconcerted acetylation homeostasis. Cell Death Differ 2006; 13: 539–550. - PMC - PubMed
    1. 4Rouaux C, Jokic N, Mbebi C, Boutillier S, Loeffler JP, Boutillier AL. Critical loss of CBP/p300 histone acetylase activity by caspase-6 during neurodegeneration. EMBO J 2003; 22: 6537–6549. - PMC - PubMed
    1. 5Rouaux C, Panteleeva I, René F, Gonzalez de Aguilar JL, Echaniz-Laguna A, Dupuis L et al. Sodium valproate exerts neuroprotective effects in vivo through CREB-binding protein-dependent mechanisms but does not improve survival in an amyotrophic lateral sclerosis mouse model. J Neurosci 2007; 27: 5535–5545. - PMC - PubMed

Publication types

MeSH terms