. 2014 Jun 20:5:4176.
doi: 10.1038/ncomms5176.

Correlated defect nanoregions in a metal-organic framework

Affiliations

Correlated defect nanoregions in a metal-organic framework

Matthew J Cliffe et al. Nat Commun. .

Abstract

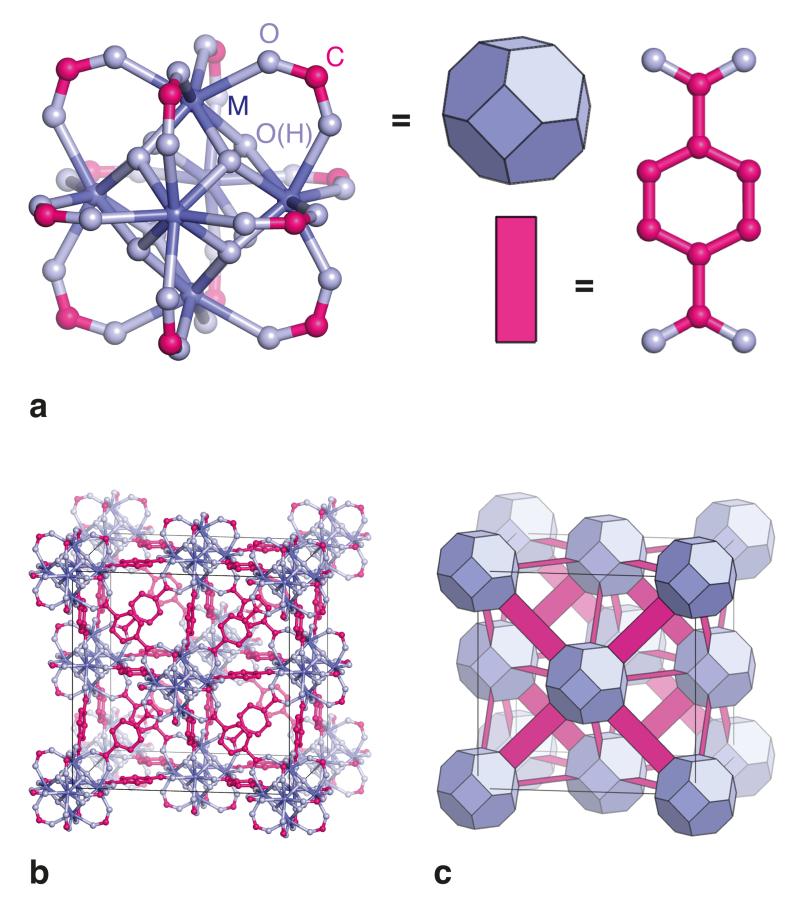
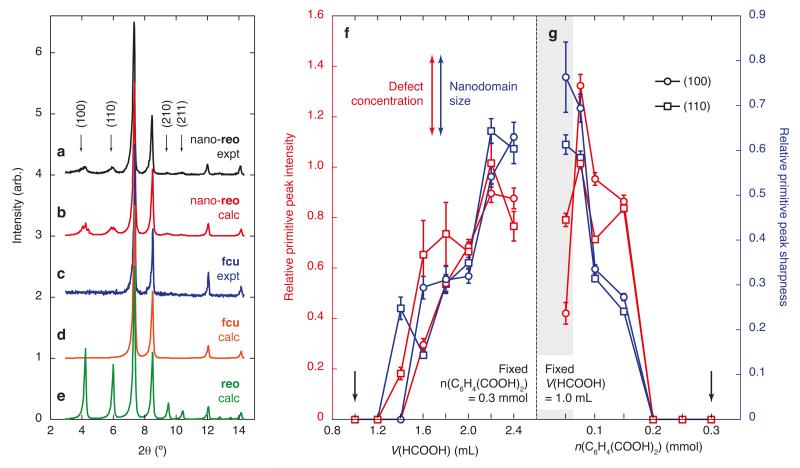
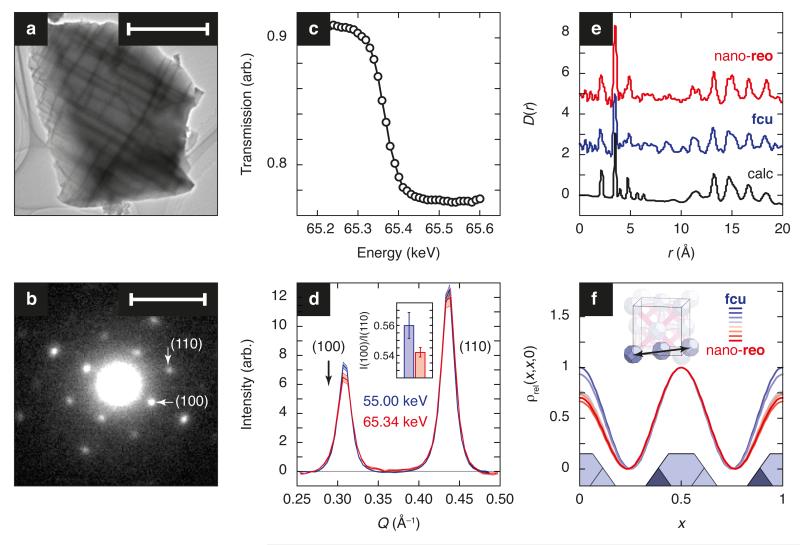
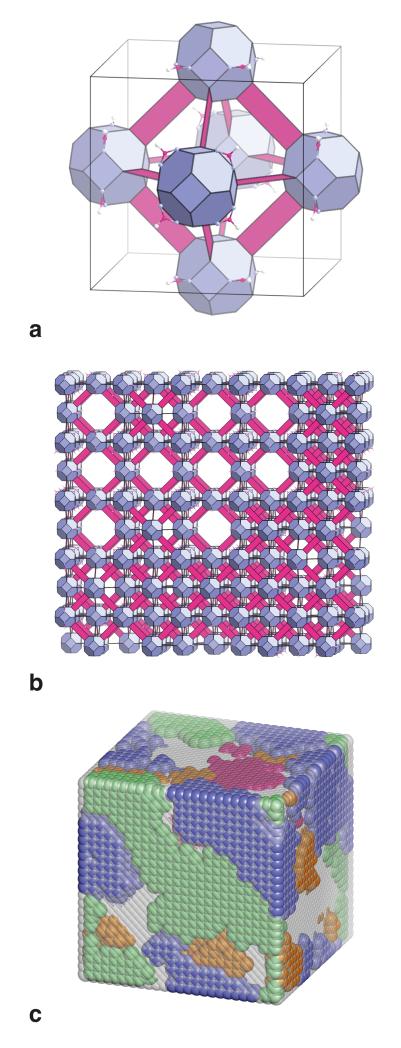
Throughout much of condensed matter science, correlated disorder is a key to material function. While structural and compositional defects are known to exist within a variety of metal-organic frameworks (MOFs), the prevailing understanding is that these defects are only ever included in a random manner. Here we show--using a combination of diffuse scattering, electron microscopy, anomalous X-ray scattering and pair distribution function measurements--that correlations between defects can in fact be introduced and controlled within a hafnium terephthalate MOF. The nanoscale defect structures that emerge are an analogue of correlated Schottky vacancies in rocksalt-structured transition metal monoxides and have implications for storage, transport, optical and mechanical responses. Our results suggest how the diffraction behaviour of some MOFs might be reinterpreted, and establish a strategy of exploiting correlated nanoscale disorder as a targetable and desirable motif in MOF design.


Figures

Figure 1
Figure 1. Structural description of UiO-66 metal–organic frameworks
(a) The fundamental building unit of the UiO-66 framework type is a six-centre metal cluster, in which eight-coordinate cations (M) are connected via carboxylate linkers in an octahedral arrangement. Capping the faces of each M6 octahedron are eight μ3-O bridges, of which four are protonated in order to account for charge balance. M atoms are shown in dark blue, O atoms in light blue, and C atoms in magenta. Terephthalate (1,4-benzenedicarboxylate) linkers (a, right) connect these units such that the clusters adopt an expanded face-centred cubic (fcu) arrangement, as shown in panel (b). In this topology, each cluster is connected to twelve neighbouring clusters by terephthalate linkers. The colour scheme is as in (a); hydrogen atoms are omitted for clarity. (c) A simplified polyhedral representation of the same network structure. The blue truncated octahedra and magenta rectangles correspond, respectively, to M6 cluster coordination polyhedra and terephthalate linkers.
Figure 2
Figure 2. Chemical control over defect nano-region concentration and domain size
(a) The experimental low-angle X-ray diffraction pattern of UiO-66(Hf), measured over the angular range 3–15° (λ = 1.541 Å), consists of a sharp Bragg scattering component with reflections obeying the conditions expected for the face-centred cubic lattice illustrated in Figure 1 and a less-intense diffuse scattering component centred on ‘forbidden’ reflection positions associated with a primitive cubic superstructure. The four most intense diffuse scattering peaks are highlighted by arrows. Conventional crystallographic analysis of this pattern is illustrated in Supplementary Figure 29. (b) The corresponding diffraction pattern calculated from the reo defect nano-region model described in the text: the intensities and peakwidths of both Bragg and diffuse scattering contributions are quantitatively accounted for by this model. The experimental (c) and calculated (d) diffraction patterns for a defect-free fcu framework, showing the absence of diffuse scattering features. (e) A long-range-ordered reo model gives rise to superlattice peaks in the same positions as those observed in (a), but simultaneously overestimates peak intensities and underestimates peakwidths. Instead the relative intensities and widths of the diffuse superlattice reflections measure defect concentration and domain size, respectively. (f) Increasing modulator (formic acid) concentration for fixed linker concentration during synthesis results in a higher concentration of reo nano-regions of increasing domain size, as does (g) decreasing linker concentration for fixed modulator concentration. Points of identical composition are indicated by arrows; the shaded region in (g) corresponds to compositions for which additional phases are present. For all data points in panels (g) and (h), the solvothermal reaction conditions used were as follows: 48 h, 120 °C, 4 ml DMF, 0.3 mmol HfCl4; HCOOH and C6H4(COOH)2 concentrations as indicated in the plots. Relative primitive peak sharpness values (blue data points) were determined as the ratio of peak widths σ(111)/σ(100) and σ(111)/σ(110) extracted from Pawley profile fitting; relative primitive peak intensities (red data points) were determined as the ratio of observed primitive peak intensity to the extrapolated value at maximum defect concentration. The error bars represent standard uncertainties in the mean values.
Figure 3
Figure 3. Experimental characterisation of correlated defect inclusion
(a) UiO-66(Hf) crystallites show a complex microstructure (domain size ca 0.1–0.4 μm) with domain walls oriented perpendicular to the ⟨100⟩ crystal axes; scale bar represents 1 μm. The dark lines at domain boundaries correspond to planes of mass contrast viewed in cross-section and are too thin to contribute to the diffraction pattern [Supplementary Figure 1(a)]. (b) The selected-area electron diffraction (SAED) pattern of the same crystallite shows that the primitive superlattice peaks identified in Figure 2 (i) do not arise from a separate phase and (ii) retain cubic symmetry; scale bar represents 0.1 Å−1 (1/d; i.e. Q = 0.63 Å−1). The particular example shown here is for the sample with largest defect concentration and nanodomain size. Note that any diffraction texture arising from the microstructure in (a) corresponds to periodicities of the order of 10−3 Å−1, which is small with respect to the scale used in (b) and the diffraction patterns reported in Figure 2. (c) Location of the X-ray absorption edge associated with the Hf K transition, determined using transmission measurements of the nano-reo UiO-66(Hf) phase. (d) Anomalous X-ray scattering at the Hf K-edge (65.34 keV) results in a small (1–5%) variation in background-subtracted diffraction intensities relative to off-edge measurements (here, 55 keV) for those peaks to which Hf scattering contributes, seen here to include the superlattice reflections. The inset shows the difference in the ratio I(100)/I(110) at these two energies. (e) As a result of the large Hf X-ray scattering cross-section, X-ray PDF measurements are dominated by Hf pair correlations; these correlations show the local Hf coordination environment (i.e., cluster geometry) is similar in nano-reo (top, raised by 5 units) and non-defective fcu (middle, raised by 2.5 units) UiO-66(Hf) samples, and is well-modelled by the structure determined crystallographically (bottom). (f) Coarse-grained Fourier maps reconstructed from the low-angle diffraction patterns of Figure 2 reveal a systematic decrease in scattering intensity at the unit cell origin with increasing defect concentration that is consistent with short-range ordering of cluster vacancies on the primitive cubic lattice.
Figure 4
Figure 4. Structural description of defect nano-regions in UiO-66(Hf)
(a) A polyhedral representation of a single unit cell of the (ordered) reo defect structure, using the same colour scheme employed in Figure 1(c) and making use of the atomic coordinates and unit cell parameters extracted from the equilibrium structure obtained in our density functional theory calculations [Supplementary Table 10]. In this model, 25% of the cluster sites are vacant and the cluster coordination number is reduced from 12 to eight. The clusters occupy Nb sites in the defect-vacancy structure of the transition-metal monoxide NbO. (b) A representative section of the atomistic model from which the simulated diffraction pattern shown in Figure 2(b) is generated. Defect-rich nano-regions are dispersed throughout a matrix of defect-free fcu framework. (c) The defect concentration and domain size parameters determined experimentally can be used to generate atomistic representations of defect nano-regions in UiO-66(Hf). The representation given here is for a 6×6×6 supercell of the fcu unit cell (total edge length 12.4 nm), chosen for clarity to be smaller by a factor of 43 than those configurations used to calculate the diffraction pattern shown in Figure 2(b). There are four possible orientations of the reo defect structure relative to the bulk fcu framework, corresponding to the four cluster positions in the fcu unit cell. In the representation used here, individual clusters are not shown but nano-domains corresponding to each of these four orientations are represented by blue, green, orange, and magenta regions. Grey-coloured regions correspond to defect-free fcu framework.

References

    1. Xu G, Zhong Z, Bing Y, Ye Z-G, Shirane G. Electric-field-induced redistribution of polar nano-regions in a relaxor ferroelectric. Nature Mater. 2006;5:134–140. - PubMed
    1. Adams CP, Lynn JW, Mukovskii YM, Arsenov AA, Shulyatev DA. Charge ordering and polaron formation in the magnetoresistive oxide La0.7Ca0.3MnO3. Phys. Rev. Lett. 2000;85:3954–3957. - PubMed
    1. Miller TA, Wittenberg JS, Wen H, Connor S, Cui Y, Lindenberg AM. The mechanism of ultrafast structural switching in superionic copper (I) sulphide nanocrystals. Nature Commun. 2012;4:1369. - PubMed
    1. Tealdi C, Mustarelli P, Islam MS. Layered LaSrGa3O7-based oxide-ion conductors: cooperative transport mechanisms and flexible structures. Adv. Funct. Mater. 2011;22:3874–3880.
    1. Bunck DN, Dichtel WR. Mixed linker strategies for organic framework functionalization. Chem. Eur. J. 2013;19:818–827. - PubMed

Publication types