. 2014 Jul 15;5(13):4765-78.
doi: 10.18632/oncotarget.2017.

Combining AKT inhibition with chloroquine and gefitinib prevents compensatory autophagy and induces cell death in EGFR mutated NSCLC cells

Affiliations

Combining AKT inhibition with chloroquine and gefitinib prevents compensatory autophagy and induces cell death in EGFR mutated NSCLC cells

Sivan M Bokobza et al. Oncotarget. .

Abstract

Although non-small cell lung cancer (NSCLC) patients with EGFR mutation positive (EGFR M+) tumors initially respond well to EGFR tyrosine kinase inhibitor (TKI) monotherapy, the responses are usually incomplete. In this study we show that AKT inhibition, most importantly AKT2 inhibition, synergises with EGFR TKI inhibition to increase cell killing in EGFR M+ NSCLC cells. However, our data also suggest that the synergistic pro-apoptotic effects may be stunted due to a prosurvival autophagy response induced by AKT inhibition. Consequently, inhibiting autophagy with chloroquine significantly enhanced tumor cell death induced by gefitinib and AKT inhibitors in EGFR M+ cells in vitro, and produced greater tumor shrinkage in EGFR M+ xenografts in vivo. Together, our findings suggest that adding chloroquine to EGFR and AKT inhibition has the potential to improve tumor responses in EGFR M+ NSCLC, and that selective targeting of AKT2 may provide a new treatment option in NSCLC.


Figures

Figure 1
Figure 1. The effect of combining gefitinib and MK2206 on growth and clonogenic survival of NSCLC cells
A, Proliferation assay of NSCLC cells in presence of MK2206 and/or gefitinib for 96 h. The dose range studied for each drug was approximately 0.25x to 8.0x the IC50 value for each cell line. B, Clonogenic survival of NSCLC cells treated with gefitinib (0.1μM for PC-9 and HCC-827; 1μM for A549 and H1975) and/or MK2206 (1μM) for 24 h, *P<0.05 and **P<0.01, compared to gefitinib alone, but there was no difference observed in A549 or H1975 cells. Data are mean ± SEM (n=3).
Figure 2
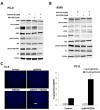
Figure 2. The effect of combining gefitinib and MK2206 on EGFR downstream signaling and apoptosis of NSCLC cells
Western blots of A, PC-9 and B, A549 cells treated with gefitinib (0.1μM and 1μM, respectively) and MK2206 (1μM) for 24 h. The β-Actin was used as a loading control and blots are representative of at least 2 repeats. C, Drug-induced apoptosis assay. Cells were treated with gefitinib (PC-9, 0.1μM; A549, 1μM), MK2206 (1μM), or the combination, for 18 h. Cells with condensed bright nuclei (white arrow) were scored as apoptotic, *P<0.05, compared to either drug alone. Data represent mean apoptotic levels ± SEM (n=3).
Figure 3
Figure 3. The effect of selective inhibition of AKT isoforms with siRNA on the gefitinib response of NSCLC cells
A, Cell proliferation 24 h following siRNA treatment, in combination with gefitinib (0.1μM, PC-9; 1μM, A549), and left to grow for 96 h before proliferation rate was measured using resazurin. *P<0.05, **P<0.01, compared with gefitinib treated non-targeting control (NT). B, Apoptosis assay 54 h after siRNA treatment, in combination with gefitinib (0.1μM, PC-9; 1μM, A549) for 18 h, *P<0.05 and **P<0.01, compared with gefitinib treated NT control. Data represent mean apoptotic levels ± SEM (n=3).
Figure 4
Figure 4. The effect of selective AKT inhibitors on the gefitinib induced apoptosis in NSCLC cells
A, PC-9 and B, A549 cells were treated with 0-10μM of each of the AKT inhibitors (MK2206, AKT1/2i, and AKT2i) with or without 0.1/1μM of gefitinib for 18 h, *P<0.05, ** P<0.01, compared with either drug alone. C, PC-9 cells were treated with 10μM of each of the AKT inhibitors either alone or in combination with 0.1μM gefitinib before western blotting for PARP. Percentage of cleaved PARP was calculated by normalising to β-Actin levels and dividing the densitometry values of cleaved PARP by total PARP, + indicates the presence of the compound and – represents its absence. Blot is representative of at least 2 independent repeats.
Figure 5
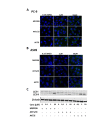
Figure 5. The effect of AKT inhibition on autophagy in NSCLC cells
LC3 immunofluorescence of A, PC-9 and B, A549 cells treated with 0-10μM of each of the AKT inhibitors for 24 h (n=3). C, LC3 western blotting of PC-9 cells treated with 0-10μM of each of the AKT inhibitors for 24 h, + indicates the presence of the compound and – represents its absence. Blot representative of at least 2 independent repeats.
Figure 6
Figure 6. The effect of inhibiting autophagy on the gefitinib response of NSCLC cells
Apoptosis assay of A, PC-9 and B, A549 cells treated with each of the AKT inhibitors (10μM), gefitinib (0.1/1μM), chloroquine (20μM), a combination of chloroquine with each of the drugs, or a combination of chloroquine, an AKT inhibitor, and gefitinib, for 18 h, **P<0.01 and *P<0.05, compared with gefitinib combined with corresponding AKT inhibitor. For presentation purposes, chloroquine is shortened to CHQ. Data represent mean apoptotic levels ± SEM (n=3). C, Western blotting for PARP cleavage in PC-9 cells treated with each of the AKT inhibitors (10μM) and chloroquine (20μM), with or without gefitinib (0.1μM) for 24 h, + indicates the presence of the compound and – represents its absence. Lines represent where the gel was cut and spliced to form this image. Blot is representative of at least 2 independent repeats.
Figure 7
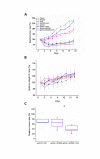
Figure 7. A, Balb/C nude mice harboring HCC-827 xenografts (100mm) were treated with vehicle control (p.o, days 1-3), gefitinib
(p.o. 25mg/kg, days 1-3), MK2206 (p.o. 50mg/kg, days 1-3), chloroquine (i.p. 60mg/kg, days 1-3), gefitinib and chloroquine, MK2206 and chloroquine, gefitinib and MK2206, or gefitinib, MK2206, and chloroquine. Data are represented as relative tumor size normalised to day 0 (100%). B, relative weight of mice over course of experiment was calculated by normalising to day 0 (100%). C, relative tumor size of combination treatments on day 3 (immediately after treatment), *p<0.05.

References

    1. Jemal A, Bray F, Center MM, Ferlay J, Ward E, Forman D. Global Cancer Statistics. Ca-a Cancer Journal for Clinicians. 2011;61(2):69–90. - PubMed
    1. Brambilla E, Travis WD, Colby TV, Corrin B, Shimosato Y. The new World Health Organization classification of lung tumours. European Respiratory Journal. 2001;18(6):1059–1068. - PubMed
    1. Lynch TJ, Bell DW, Sordella R, Gurubhagavatula S, Okimoto RA, Brannigan BW, Harris PL, Haserlat SM, Supko JG, Haluska FG, Louis DN, Christiani DC, Settleman J, Haber DA. Activating mutations in the epidermal growth factor receptor underlying responsiveness of non-small-cell lung cancer to gefitinib. New England Journal of Medicine. 2004;350(21):2129–2139. - PubMed
    1. Pao W, Miller V, Zakowski M, Doherty J, Politi K, Sarkaria I, Singh B, Heelan R, Rusch V, Fulton L, Mardis E, Kupfer D, Wilson R, Kris M, Varmus H. EGF receptor gene mutations are common in lung cancers from “never smokers” and are associated with sensitivity of tumors to gefitinib and erlotinib. Proceedings of the National Academy of Sciences of the United States of America. 2004;101(36):13306–13311. - PMC - PubMed
    1. Kobayashi S, Boggon TJ, Dayaram T, Janne PA, Kocher O, Meyerson M, Johnson BE, Eck MJ, Tenen DG, Halmos B. EGFR mutation and resistance of non-small-cell lung cancer to gefitinib. New England Journal of Medicine. 2005;352(8):786–792. - PubMed

Publication types

MeSH terms