. 2014 Jun 19:9:12.
doi: 10.1186/1745-6150-9-12.

Selecting biologically informative genes in co-expression networks with a centrality score

Affiliations

Selecting biologically informative genes in co-expression networks with a centrality score

Francisco J Azuaje. Biol Direct. .

Abstract

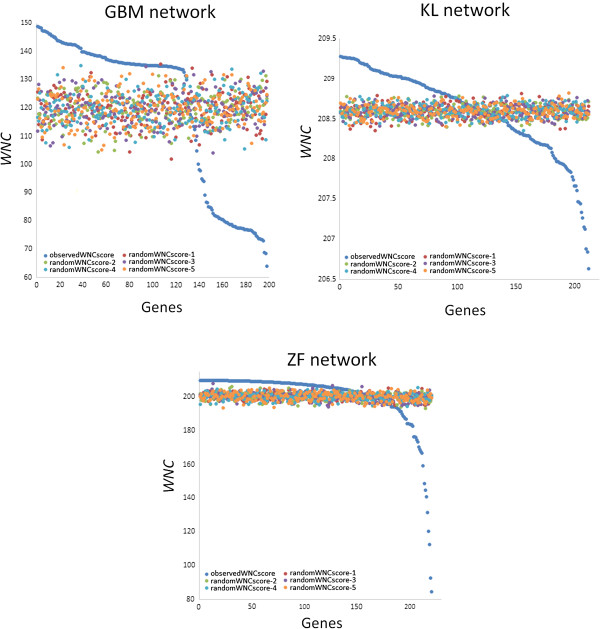
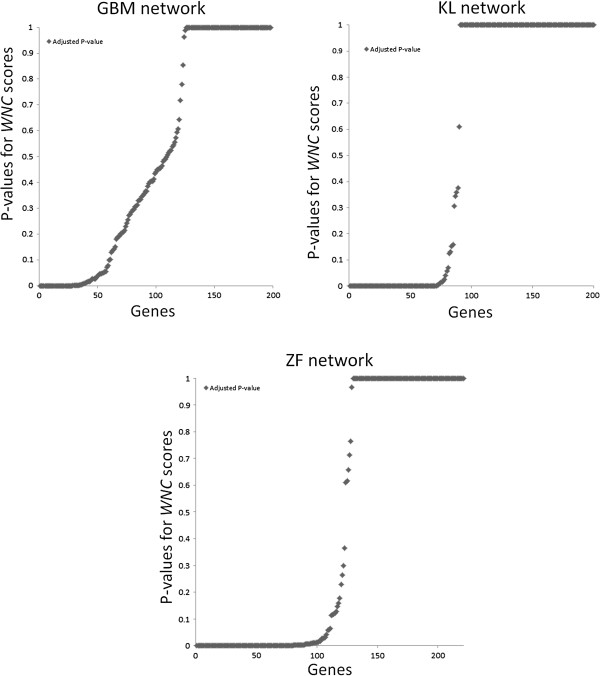
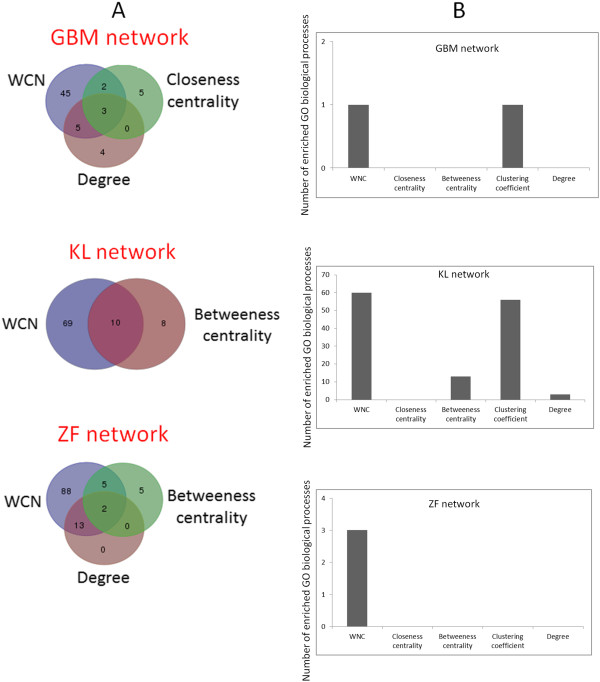
Background: Measures of node centrality in biological networks are useful to detect genes with critical functional roles. In gene co-expression networks, highly connected genes (i.e., candidate hubs) have been associated with key disease-related pathways. Although different approaches to estimating gene centrality are available, their potential biological relevance in gene co-expression networks deserves further investigation. Moreover, standard measures of gene centrality focus on binary interaction networks, which may not always be suitable in the context of co-expression networks. Here, I also investigate a method that identifies potential biologically meaningful genes based on a weighted connectivity score and indicators of statistical relevance.

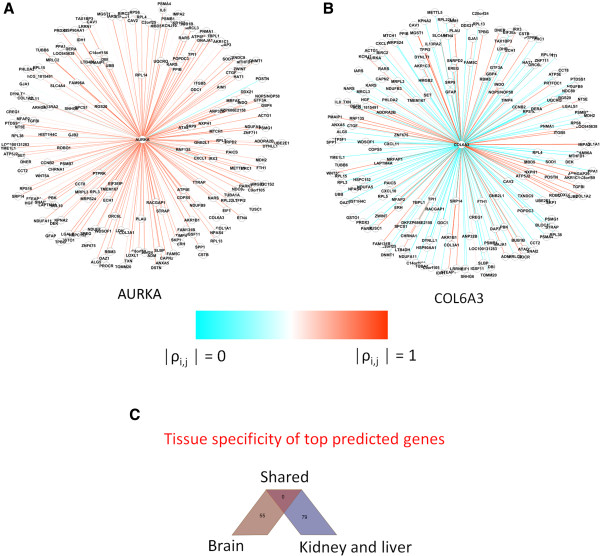
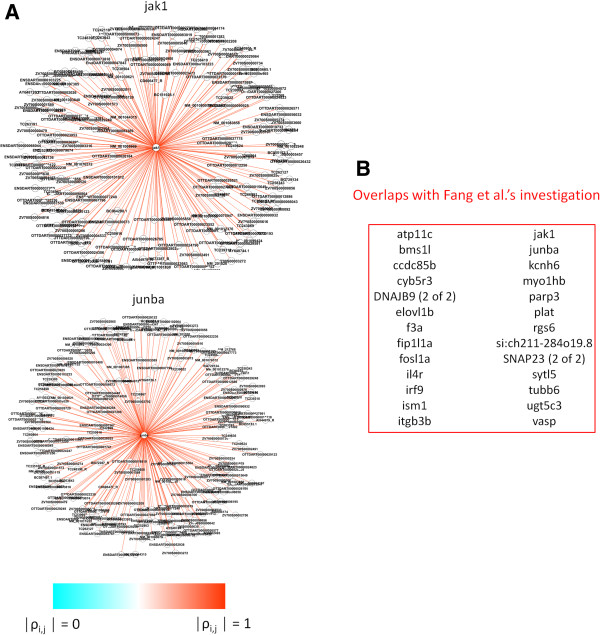
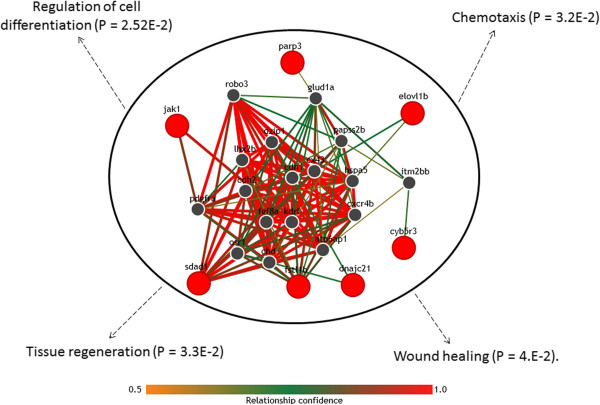
Results: The method enables a characterization of the strength and diversity of co-expression associations in the network. It outperformed standard centrality measures by highlighting more biologically informative genes in different gene co-expression networks and biological research domains. As part of the illustration of the gene selection potential of this approach, I present an application case in zebrafish heart regeneration. The proposed technique predicted genes that are significantly implicated in cellular processes required for tissue regeneration after injury.

Conclusions: A method for selecting biologically informative genes from gene co-expression networks is provided, together with free open software.


Figures

Figure 1
Figure 1
Distribution of WNC scores in real and permuted co-expression networks.WNC values from the real and permuted networks are color-coded. To give a sense of the distribution of random samples, the results from 5 permuted networks are shown.
Figure 2
Figure 2
Identification of statistically significant genes based on WNC scores. For each network, the adjusted P values computed for all the WNC scores is displayed. Genes with low P values represent potential biologically relevant genes and can be used for further analysis.
Figure 3
Figure 3
Examples of top genes with highly significant WNC scores in the GBM network. Genes detected with WNC scores are shown as central nodes with their respective co-expression relationships. Panel A shows an example of gene with significant WNC score (AURKA, P = 0). Example of a gene with a statistically spurious WNC (COL6A3, P =1) is shown in B. Edges are color-coded to reflect the intensity of the gene co-expression values. C: top predicted genes from GBM and KL networks do not overlap, which suggest tissue specificity of the observed associations.
Figure 4
Figure 4
Comparison of gene sets identified by WNC and standard centrality scores. A. Venn diagrams depicting overlaps between the gene sets identified by the different methods. Only the largest overlaps with WNC are shown to facilitate visualization. B. Statistically significant GO enrichments found in the predicted gene sets.
Figure 5
Figure 5
Top-ranked genes detected by WNC score analysis. A. Examples of top predictions. B. Top genes (WNC scores with P < 0.05) that were also found as biologically relevant components of heart regeneration in a recent study by Fang et al. [28]. Their approach was based on gene differential expression analysis and independent experimental validations.
Figure 6
Figure 6
Computational prediction of associations between the top candidates in the ZF network and diverse biological processes. High-confidence associations with genes and cellular processes obtained from the IMP analysis. In the network, red nodes represent genes predicted as top candidates in the ZF network using significant WNC scores. Grey nodes represent other genes predicted by IMP to be functionally associated with the top ZF network genes. Color bar indicates the level of statistical confidence of the predicted gene-gene associations. Examples of biological processes significantly enriched in this predicted network are indicated.

References

    1. Carlson MR, Zhang B, Fang Z, Mischel PS, Horvath S, Nelson SF. Gene connectivity, function, and sequence conservation: predictions from modular yeast co-expression networks. BMC Genomics. 2006;7:40. - PMC - PubMed
    1. McDermott JE, Taylor RC, Yoon H, Heffron F. Bottlenecks and hubs in inferred networks are important for virulence in Salmonella typhimurium. J Comput Biol. 2009;16:169–180. - PubMed
    1. Liao Q, Liu C, Yuan X, Kang S, Miao R, Xiao H, Zhao G, Luo H, Bu D, Zhao H, Skogerbø G, Wu Z, Zhao Y. Large-scale prediction of long non-coding RNA functions in a coding-non-coding gene co-expression network. Nucleic Acids Res. 2011;39:3864–3878. - PMC - PubMed
    1. Hong S, Chen X, Jin L, Xiong M. Canonical correlation analysis for RNA-seq co-expression networks. Nucleic Acids Res. 2013;41:e95. - PMC - PubMed
    1. Iancu OD, Kawane S, Bottomly D, Searles R, Hitzemann R, McWeeney S. Utilizing RNA-Seq data for de novo coexpression network inference. Bioinformatics. 2012;28:1592–1597. - PMC - PubMed

Publication types

LinkOut - more resources