. 2014 Nov;63(11):3721-33.
doi: 10.2337/db14-0464. Epub 2014 Jun 19.

Mechanisms of increased in vivo insulin sensitivity by dietary methionine restriction in mice

Affiliations

Mechanisms of increased in vivo insulin sensitivity by dietary methionine restriction in mice

Kirsten P Stone et al. Diabetes. 2014 Nov.

Abstract

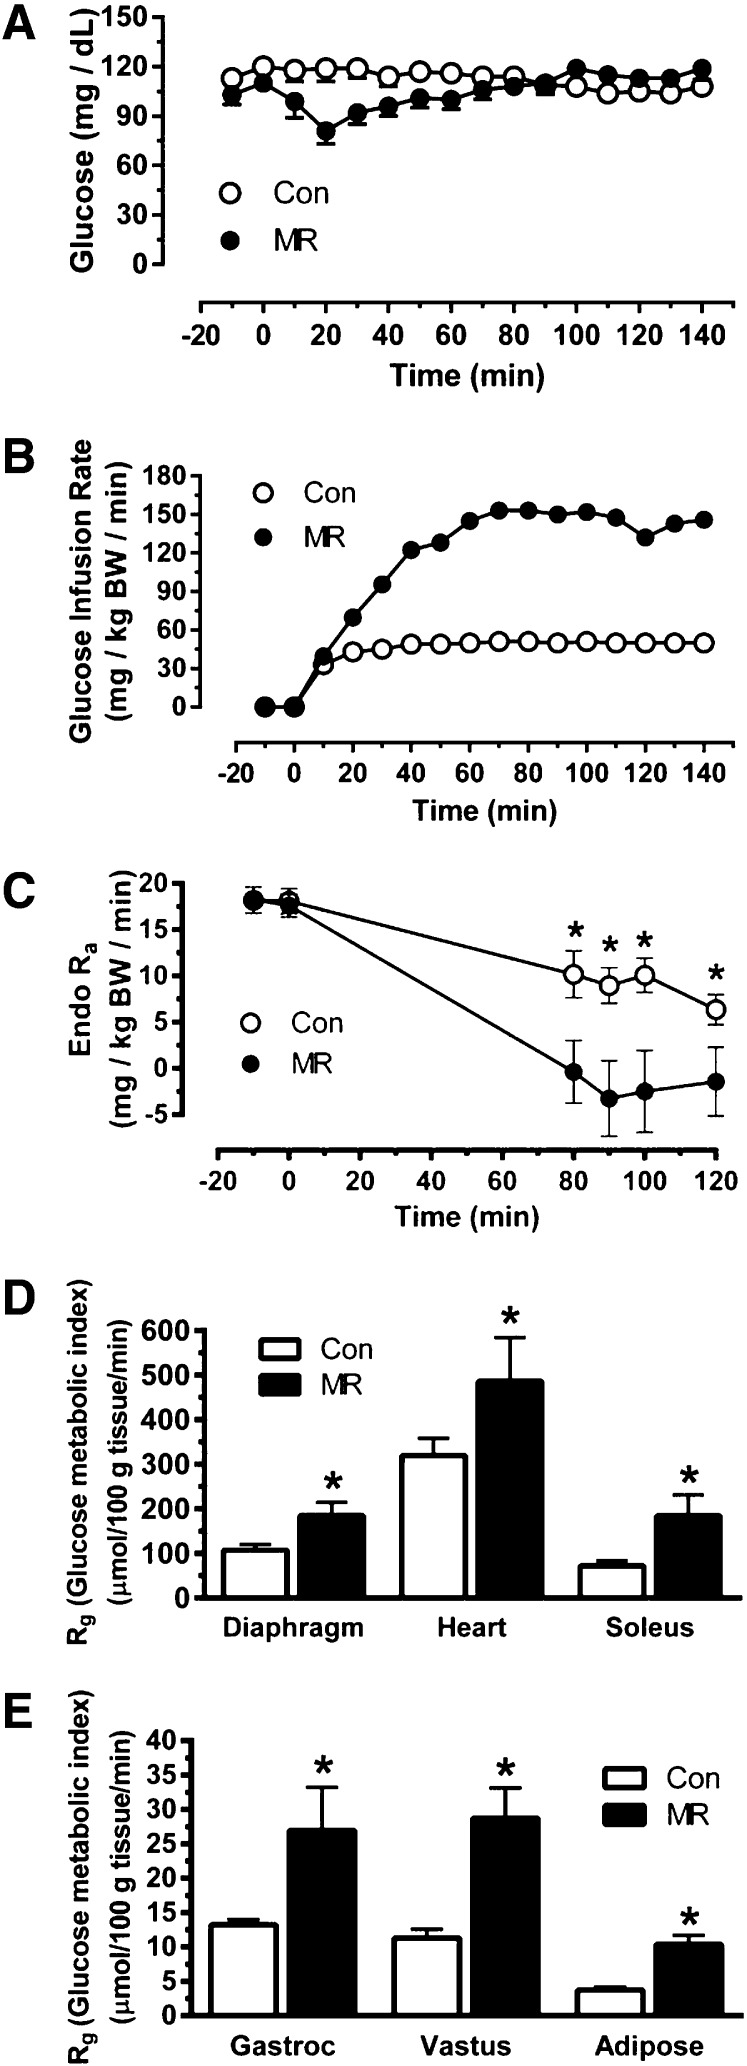
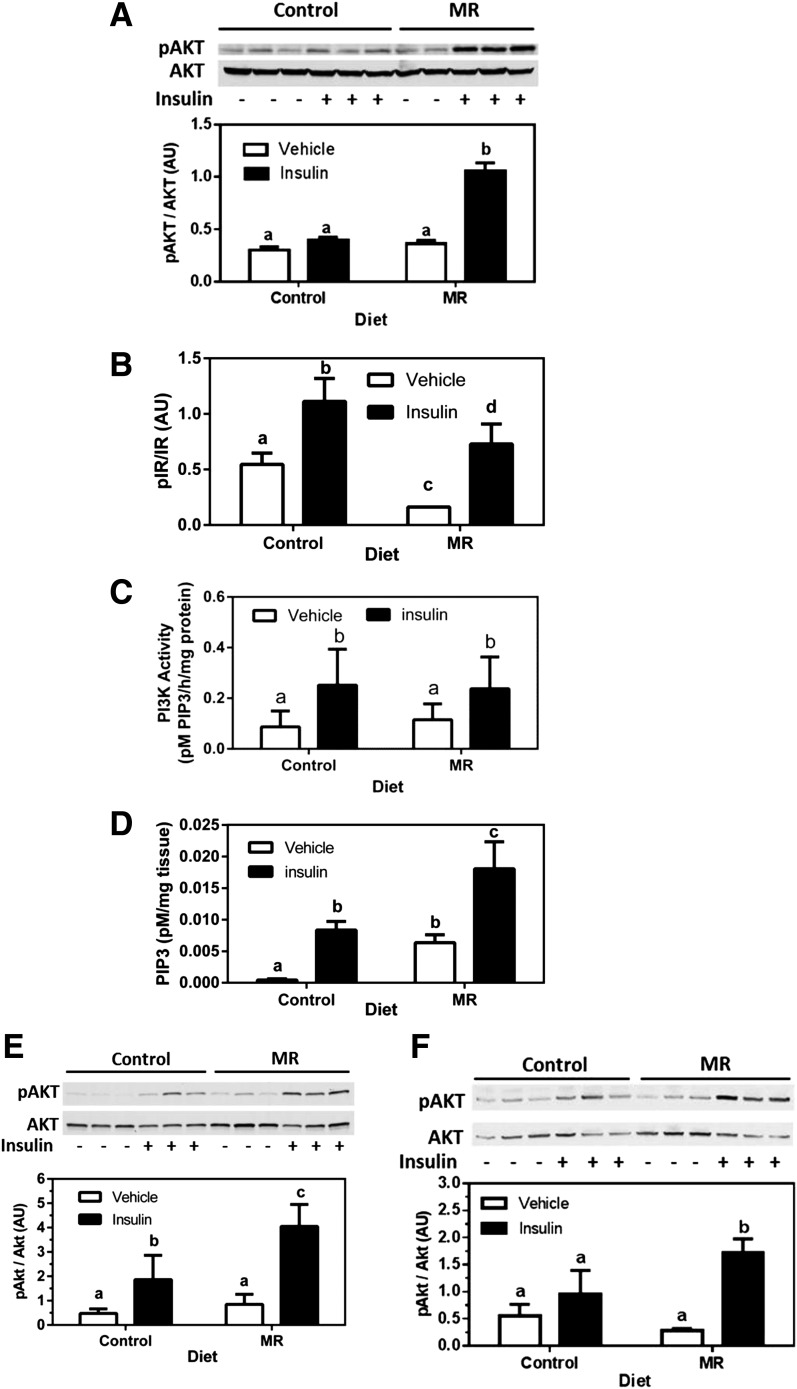
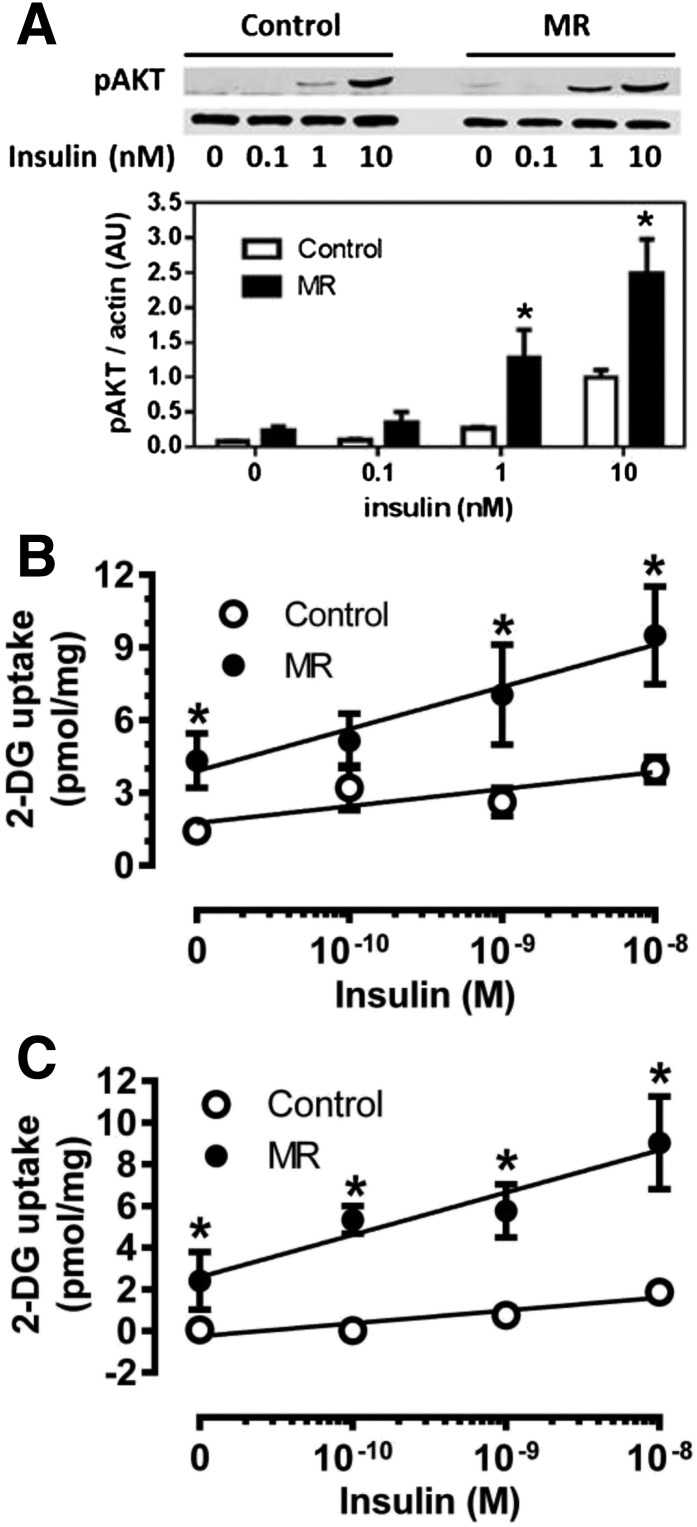
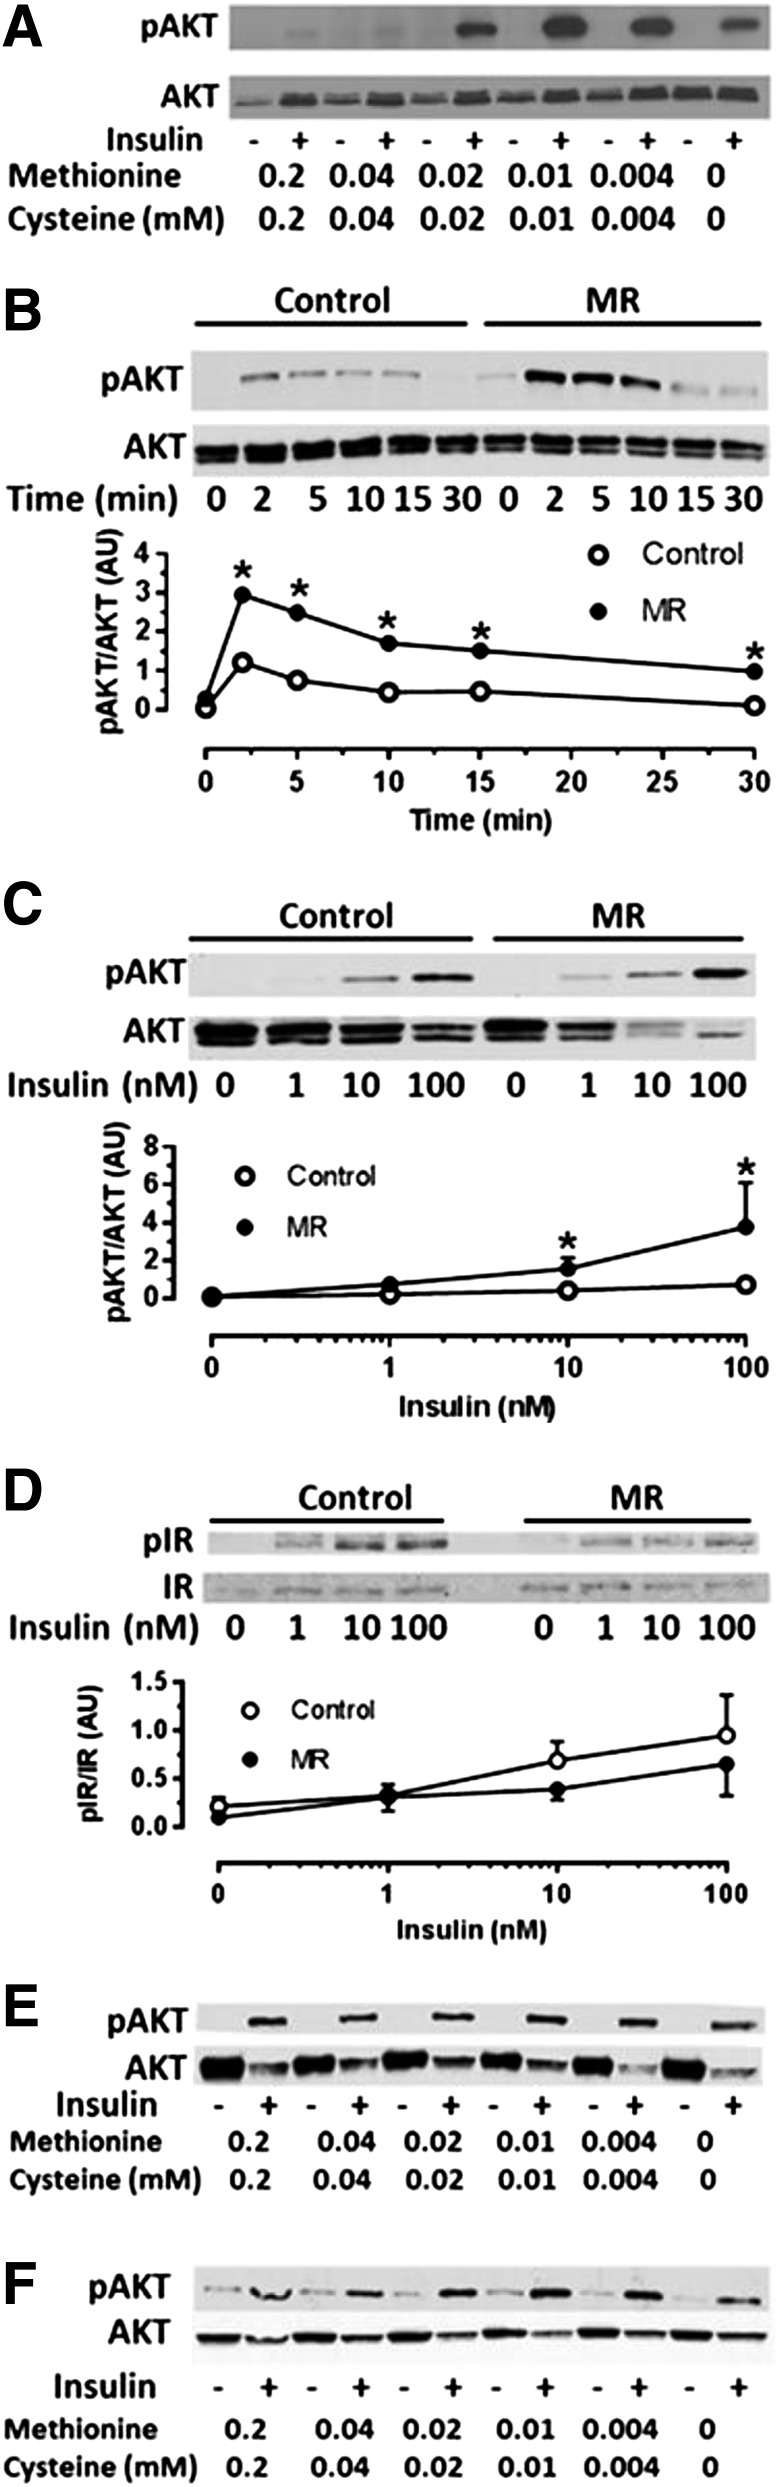
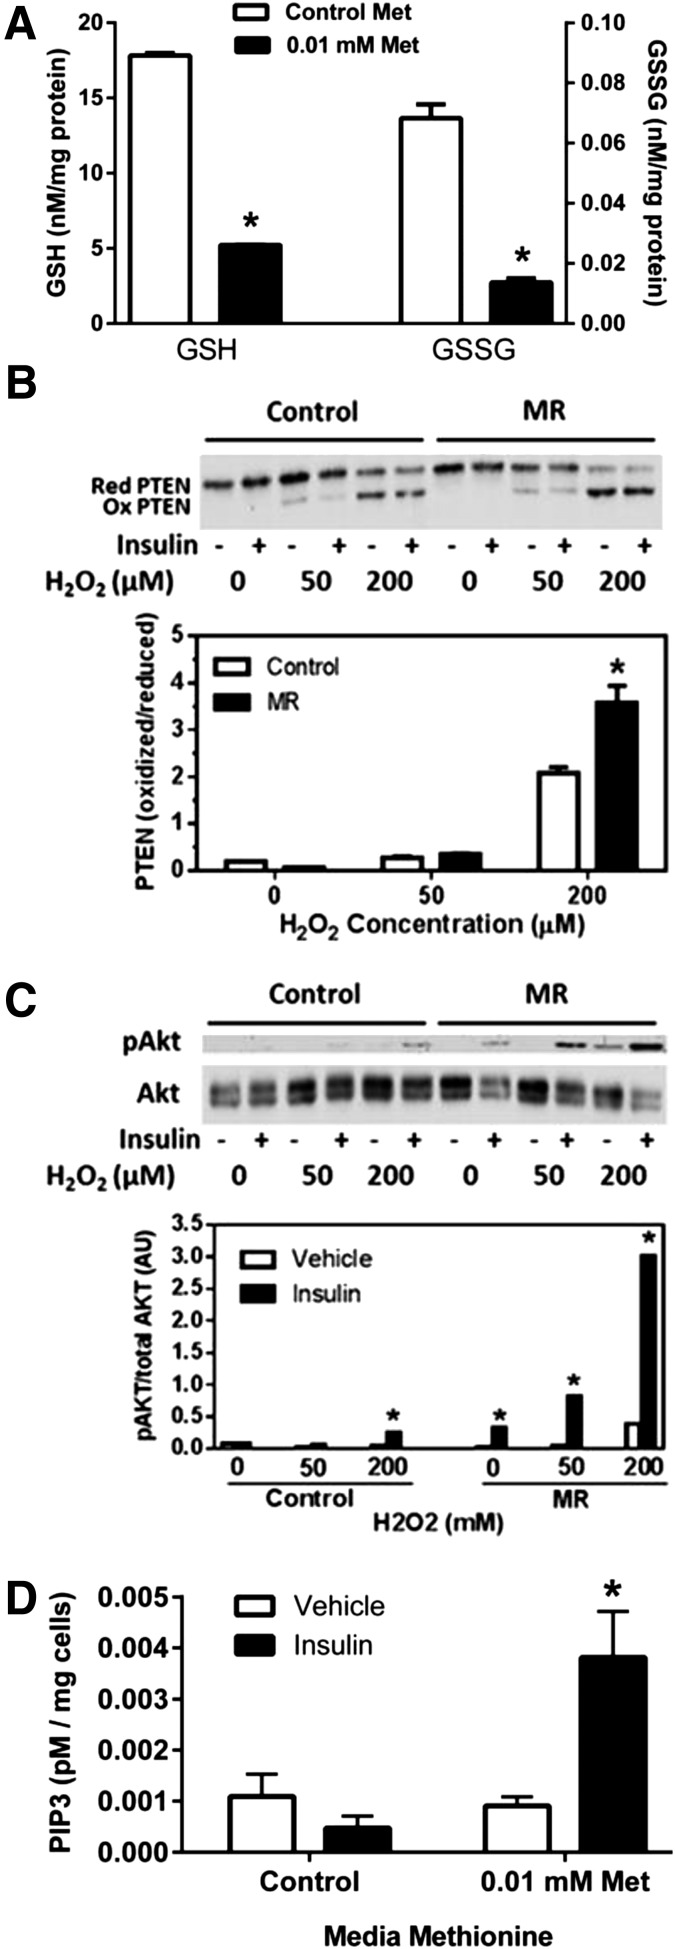
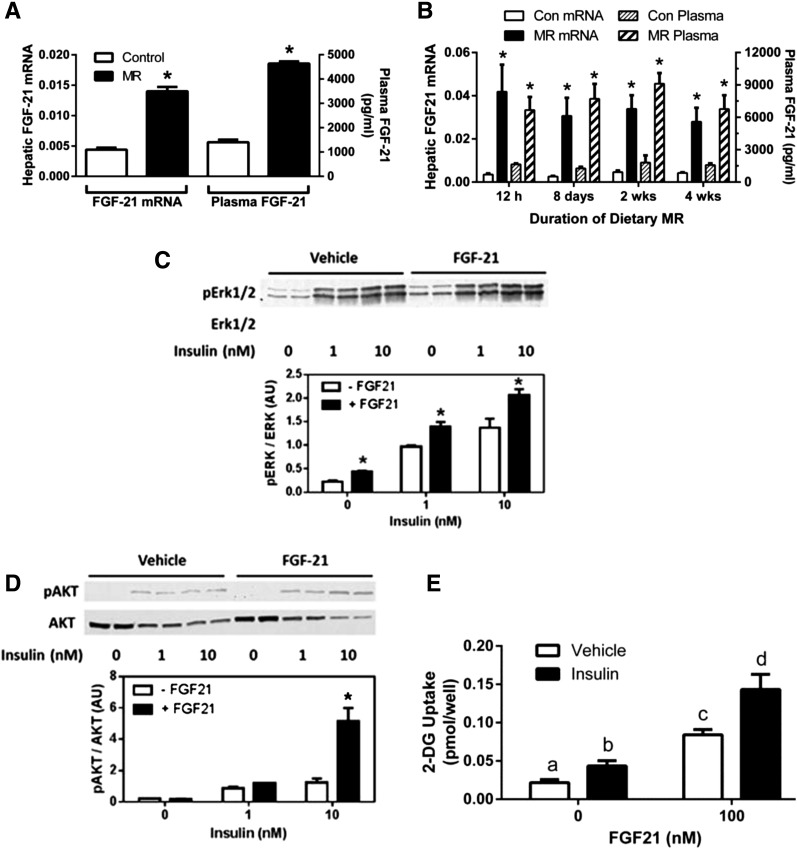
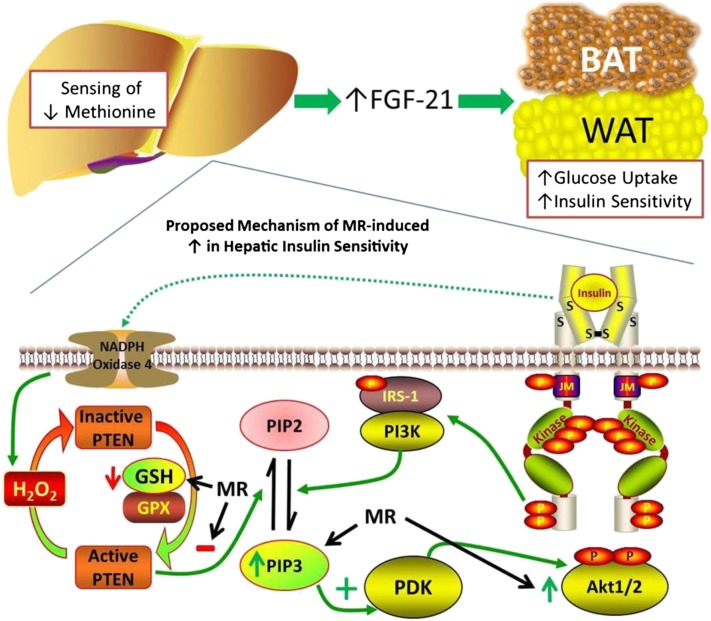
To understand the physiological significance of the reduction in fasting insulin produced by dietary methionine restriction (MR), hyperinsulinemic-euglycemic clamps were used to examine the effect of the diet on overall and tissue-specific insulin sensitivity in mice. The steady-state glucose infusion rate was threefold higher in the MR group and consistent with the 2.5- to threefold increase in 2-deoxyglucose uptake in skeletal muscle, heart, and white adipose tissue. Dietary MR enhanced suppression of hepatic glucose production by insulin, enhanced insulin-dependent Akt phosphorylation in the liver, and increased hepatic expression and circulating fibroblast growth factor 21 (FGF-21) by fourfold. Limitation of media methionine recapitulated amplification of Akt phosphorylation by insulin in HepG2 cells but not in 3T3-L1 adipocytes or C2C12 myotubes. Amplification of insulin signaling in HepG2 cells by MR was associated with reduced glutathione, where it functions as a cofactor for phosphatase and tensin homolog. In contrast, FGF-21, but not restricting media methionine, enhanced insulin-dependent Akt phosphorylation in 3T3-L1 adipocytes. These findings provide a potential mechanism for the diet-induced increase in insulin sensitivity among tissues that involves a direct effect of methionine in liver and an indirect effect in adipose tissue through MR-dependent increases in hepatic transcription and release of FGF-21.


Figures

Figure 1
Figure 1
Hyperinsulinemic-euglycemic clamps in C57BL/6J mice after 8 weeks of dietary MR. The clamp procedures were conducted as described in Research Design and Methods, and the clamp procedure was initiated at 0 min with a continuous insulin infusion (2.5 mU/kg/min) that was maintained for 140 min. Glucose was infused at a rate sufficient to maintain euglycemia until a steady-state GIR was reached. A: Blood glucose levels during the clamp procedure. B: The GIR required to maintain euglycemia during the insulin clamps. BW, body weight. C: Basal endo Ra and its suppression by insulin during the clamp procedure. D and E: Rg, an indication of tissue-specific insulin-dependent glucose uptake. Means ± SEM are presented for each variable and based on n = 8 for control diet and n = 9 for dietary MR. *Means differ from their corresponding controls at P < 0.05.
Figure 2
Figure 2
Short-term signaling responses in liver, muscle, and BAT after an acute injection of insulin in mice after 8 weeks of dietary MR. Mice fed the control or MR diets received intraperitoneal injections of saline (vehicle) or insulin (0.8 units/kg body weight) at time 0. Tissues were harvested after 12 min from the animals in each dietary group and snap frozen. Insulin-dependent phosphorylation (p) of Akt (A), IR (B), activity of IRS1-bound PI3K (C), and increases in PIP3 in liver (D). Insulin-dependent phosphorylation of Akt in gastrocnemius muscle (E) and BAT (F). Total Akt (A, E, and F) was measured as a loading control, and scanning densitometry was used to quantitate expression levels for each protein. Phosphorylated forms of each protein are expressed relative to the total. Means ± SEM are presented for each variable and based on n = 6 for control diet and n = 8 for MR. Means denoted with a different letter (a, b, c, d) differ at P < 0.05.
Figure 3
Figure 3
Effect of dietary MR on ex vivo insulin signaling and insulin-stimulated glucose uptake in isolated white and brown adipocytes. Epididymal white adipocytes or brown adipocytes were isolated after 8 weeks of dietary MR and incubated with increments of insulin for 5 min (Akt) or 15 min ([3H]-2-DG) before measurement of Akt phosphorylation (A) and [3H]-2-DG uptake (B) in white adipocytes or [3H]-2-DG uptake in brown adipocytes (C) as described in Research Design and Methods. Scanning densitometry was used to quantitate expression levels for each protein. Means ± SEM are representative of three independent experiments. *Mean responses at each insulin concentration differ from their corresponding controls at P < 0.05.
Figure 4
Figure 4
Insulin-dependent phosphorylation (p) of Akt or IR in cultured HepG2 cells (AD), C2C12 cells (E), and 3T3-L1 adipocytes (F) after incubation in media containing normal concentrations or increments of MR as described in Research Design and Methods. A: HepG2 cells were incubated for 18 h with the indicated concentrations of methionine and cysteine, followed by incubation with 10 nmol/L insulin for 5 min and measurement of Akt phosphorylation by Western blotting. B: Time-dependent phosphorylation of Akt in HepG2 cells in response to 10 nmol/L insulin after 18 h of incubation of cells with control levels (0.2 mmol/L) or restricted levels (0.01 mmol/L) of methionine and cysteine. Insulin concentration-dependent Akt phosphorylation (C) or IR phosphorylation (D) in HepG2 cells after culturing for 18 h in control (0.2 mmol/L) or restricted levels (0.01 mmol/L) of methionine and cysteine. Insulin-dependent Akt phosphorylation in C2C12 myotubes (E) or 3T3-L1 adipocytes (F) after 18 h of incubation in indicated concentrations of methionine and cysteine. Phosphorylated Akt or IR was expressed relative to total Akt or total IR. Means ± SEM are representative of three independent experiments. *Mean responses at each insulin concentration differ from their corresponding controls at P < 0.05.
Figure 5
Figure 5
Lowering of reduced GSH and oxidized GSSG levels and amplification of insulin-dependent phosphorylation of Akt by oxidation of PTEN with H2O2 in HepG2 cells cultured for 18 h in control (0.2 mmol/L) or restricted levels (0.01 mmol/L) of methionine (Met) and cysteine. A: After 18 h of incubation under these conditions, GSH and GSSG levels were measured in whole-cell extracts of HepG2 cells. Additional HepG2 cells were incubated for 5 min with 0, 50, or 200 μmol/L H2O2 in the absence and presence of 10 nmol/L insulin. B: The ratio of oxidized (Ox) to reduced (Red) PTEN was visualized by Western blotting, and a representative blot of three experiments is shown. Oxidized and reduced PTEN were quantitated by densitometry and expressed as a ratio. C: The effect of increments of H2O2 on insulin-dependent phosphorylation of Akt. Phosphorylated (p)Akt was expressed relative to total Akt. D: HepG2 cells were incubated for 18 h in control (0.2 mmol/L) or restricted levels (0.01 mmol/L) of methionine and cysteine, followed by incubation with 10 nmol/L insulin for 5 min and harvest of cells for measurement of PIP3. Means are from four replicates in two experiments. *Means ± SEM differ from their corresponding controls at P < 0.05.
Figure 6
Figure 6
The effect dietary MR on hepatic expression and plasma levels of FGF-21 after 8 wks (A), the time-dependent change in hepatic expression of FGF-21 mRNA and plasma FGF-21 after initial exposure to MR (B), and the in vitro effect of FGF-21 on insulin-dependent phosphorylation (p) of Erk1/2 (C), Akt (D), and glucose uptake in 3T3-L1 adipocytes (E). A: Plasma FGF-21 levels and hepatic FGF-21 mRNA levels in mice after 8 weeks of dietary MR. Means ± SEM are representative of eight mice per group. *Means differ from their respective controls at P < 0.05. B: Time-dependent changes in hepatic FGF-21 mRNA and plasma levels in mice after initial introduction of MR. Means ± SEM are representative of eight animals per diet per time point. *Means differ from their corresponding control at that time point at P < 0.05. C and D: Differentiated 3T3-L1 adipocytes were treated with 10 nmol/L FGF-21 for 5 min, followed by treatment with vehicle, 1 nmol/L, or 10 nmol/L insulin for 5 additional min. Insulin-dependent phosphorylation of Erk1/2 (C) or Akt (D) was measured by Western blotting. Phosphorylated Erk1/2 and Akt were expressed relative to total Erk1/2 and Akt. Means ± SEM are representative of three independent experiments. *Means at each time point differ from their corresponding controls at P < 0.05. E: Differentiated 3T3-L1 adipocytes were treated with 100 nmol/L FGF-21 for 24 h, followed by treatment with vehicle or 100 nmol/L insulin for 2 h before measurement of [3H]-2-DG uptake over the final 1 h. Means ± SEM are representative of three independent experiments. Means denoted with a different letter (a, b, c, d) differ at P < 0.05.
Figure 7
Figure 7
Schematic model of proposed mechanism for increase in insulin sensitivity in adipose tissue and the liver produced by dietary MR. PDK, phosphoinositide-dependent kinase. S denotes sulfur atoms involved in disulfide linkages that establish the secondary structure of the insulin receptor.

Similar articles

Cited by

References

    1. Orentreich N, Matias JR, DeFelice A, Zimmerman JA. Low methionine ingestion by rats extends life span. J Nutr 1993;123:269–274 - PubMed
    1. Richie JP, Jr, Leutzinger Y, Parthasarathy S, Malloy V, Orentreich N, Zimmerman JA. Methionine restriction increases blood glutathione and longevity in F344 rats. FASEB J 1994;8:1302–1307 - PubMed
    1. Miller RA, Buehner G, Chang Y, Harper JM, Sigler R, Smith-Wheelock M. Methionine-deficient diet extends mouse lifespan, slows immune and lens aging, alters glucose, T4, IGF-I and insulin levels, and increases hepatocyte MIF levels and stress resistance. Aging Cell 2005;4:119–125 - PMC - PubMed
    1. Sun L, Sadighi Akha AA, Miller RA, Harper JM. Life-span extension in mice by preweaning food restriction and by methionine restriction in middle age. J Gerontol A Biol Sci Med Sci 2009;64:711–722 - PMC - PubMed
    1. Ables GP, Perrone CE, Orentreich D, Orentreich N. Methionine-restricted C57BL/6J mice are resistant to diet-induced obesity and insulin resistance but have low bone density. PLoS ONE 2012;7:e51357. - PMC - PubMed

Publication types