. 2014 Jun 20:5:4115.
doi: 10.1038/ncomms5115.

Nitrogen stress response and stringent response are coupled in Escherichia coli

Affiliations

Nitrogen stress response and stringent response are coupled in Escherichia coli

Daniel R Brown et al. Nat Commun. .

Abstract

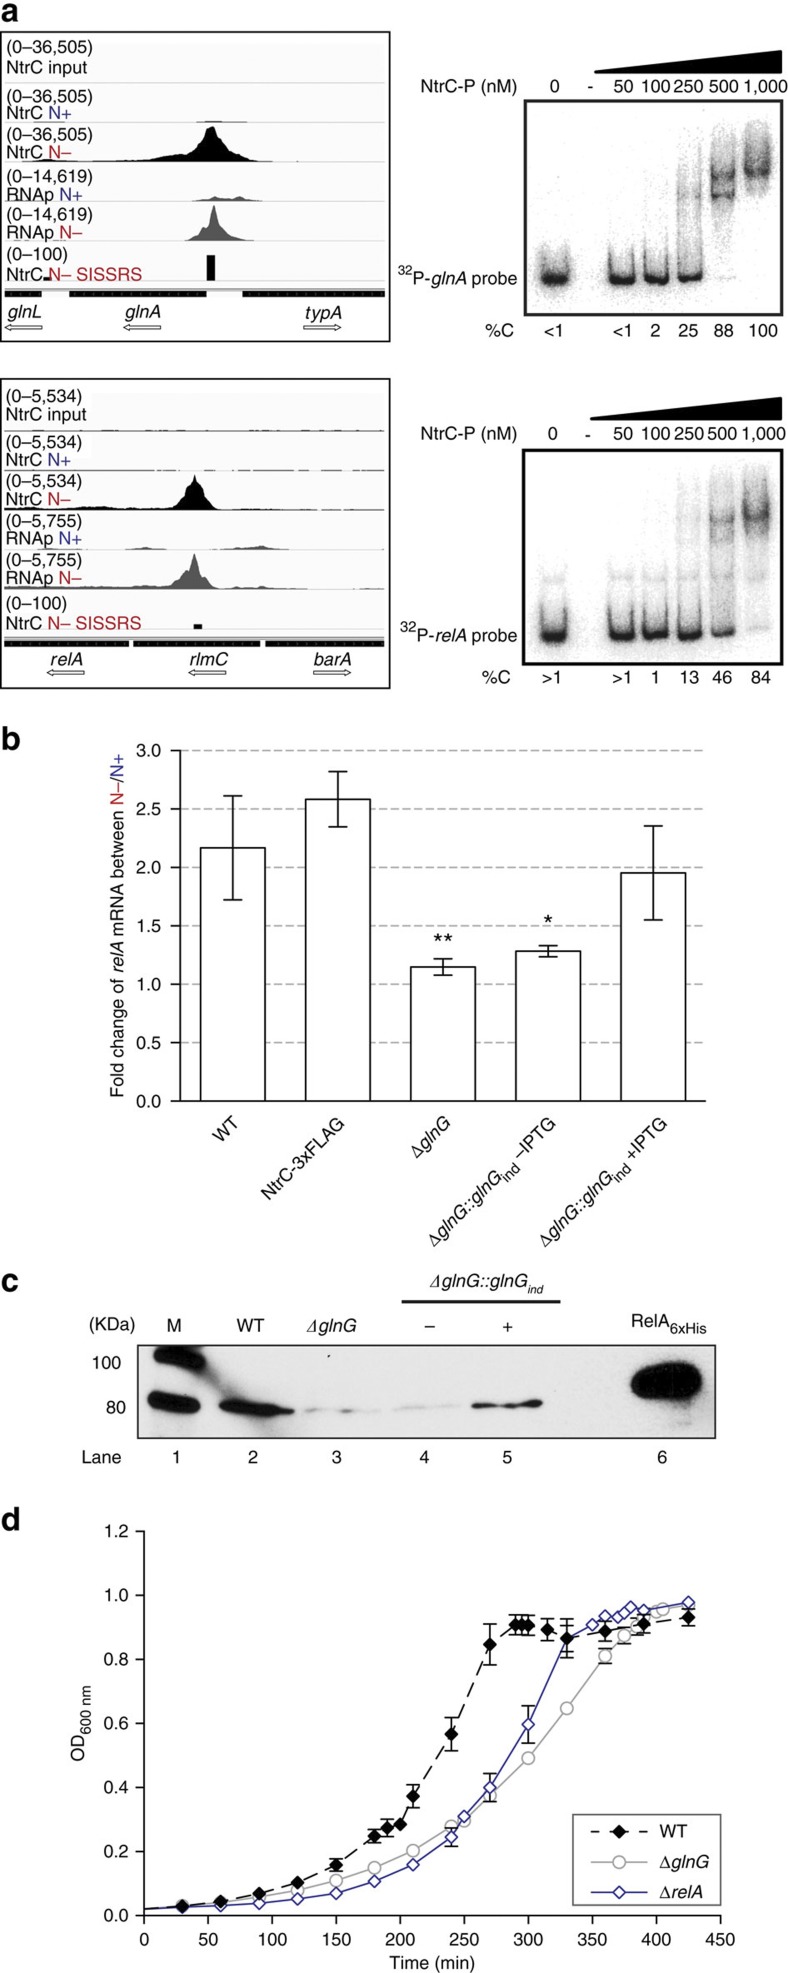
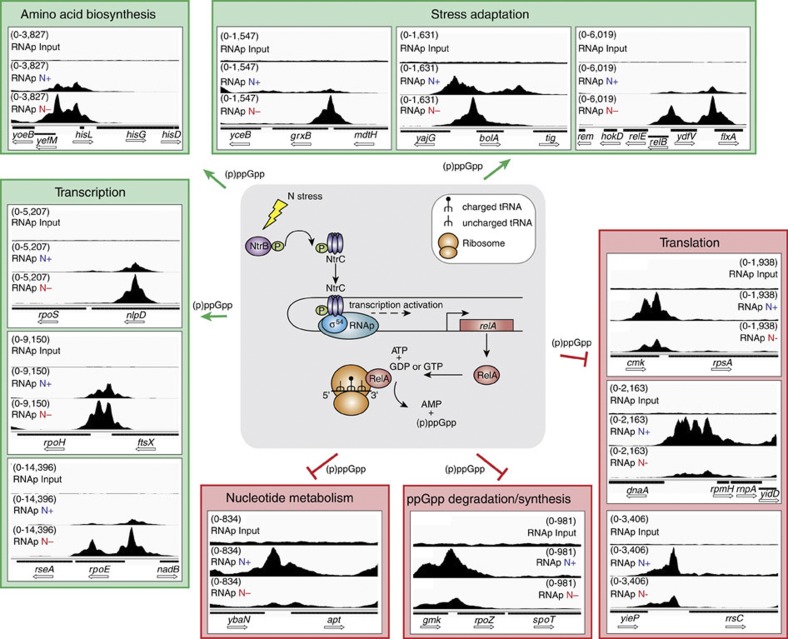
Assimilation of nitrogen is an essential process in bacteria. The nitrogen regulation stress response is an adaptive mechanism used by nitrogen-starved Escherichia coli to scavenge for alternative nitrogen sources and requires the global transcriptional regulator NtrC. In addition, nitrogen-starved E. coli cells synthesize a signal molecule, guanosine tetraphosphate (ppGpp), which serves as an effector molecule of many processes including transcription to initiate global physiological changes, collectively termed the stringent response. The regulatory mechanisms leading to elevated ppGpp levels during nutritional stresses remain elusive. Here, we show that transcription of relA, a key gene responsible for the synthesis of ppGpp, is activated by NtrC during nitrogen starvation. The results reveal that NtrC couples these two major bacterial stress responses to manage conditions of nitrogen limitation, and provide novel mechanistic insights into how a specific nutritional stress leads to elevating ppGpp levels in bacteria.


Conflict of interest statement

The authors declare no competing financial interests.

Figures

Figure 1
Figure 1. Establishing N-starved growth conditions in E. coli.
(a) The growth arrest of wild-type E. coli NCM3722 cells coincides with ammonium run out (at t=NRO) in the minimal Gutnick medium. The time points at which the E. coli cells were sampled for downstream analysis are indicated (t=N+ and t=N− represents growth under nitrogen replete and starved conditions, respectively). (b) The growth curves of wild-type NCM3722, NCM3722:glnG-FLAG (NtrC-3xFLAG), NCM3722:ΔglnG and NCM3722:ΔglnG::glnGind (−/+ IPTG). The quantitation of the doubling times is also given. (c) Graph showing the relative levels of glnK mRNA expression as fold-change in cells sampled at t=N+ and t=N−. Error bars on all growth curves represent s.d. (where n=3). Statistical significant relationships from One-way ANOVA analysis are denoted (****P<0.0001).
Figure 2
Figure 2. NtrC binds to a site upstream of relA in N-starved E. coli.
(a) Left. Shown are screenshots of Integrative Genome Viewer with tracks showing the binding profiles (tag density) as measured by ChIP-seq of NtrC (black) and RNAp (grey) in N-non-starved (denoted as N+) and N-starved (denoted as N−) E. coli aligned against the upstream regions of glnA and relA. Tracks with the input DNA control tag density (denoted as input) and with the genomic loci bound by NtrC identified by the peak-calling algorithm Site Identification for Short Sequence Reads (denoted as SISSRS) at t=N− are also shown for comparison. Right. Representative autoradiographs of non-denaturing gels showing the binding of NtrC to 32P-labelled DNA probes with sequences corresponding to the upstream regions of glnA (positions −273 to +71 relative to the translation-start site of GlnA) and relA (positions −928 to −592 relative to the translation-start site of RelA). The %C indicates the percentage of DNA bound by NtrC in comparison with unbound DNA in lane 1. (b) Graph showing the relative levels of relA mRNA expression as fold-change in cells sampled at t=N+ and t=N−. The error bars represent s.d. and statistical significant relationships from one-way ANOVA analysis are denoted (*P<0.05; **P<0.01). (c) Representative autoradiograph of a western blot (full gel image in Supplementary Fig. 8) showing expression of RelA proteins in cells sampled at t=N−. Lane 1 contains the molecular weight marker and lane 6 contains purified E. coli RelA-6xHis protein. (d) The growth curves of wild-type NCM3722, NCM3722:ΔglnG and NCM3722:ΔrelA.
Figure 3
Figure 3. NtrC couples the Ntr stress response and stringent response in N-starved E. coli.
The cartoon in the middle of the figure represents the model by which N starvation is sensed and leads to the NtrC-mediated activation of transcription of relA, which subsequently leads to the production of ppGpp. Around this cartoon, we show screenshots of Integrative Genome Viewer with tracks showing the binding profiles (tag density) as measured by ChIP-seq of RNAp binding in N-non-starved (denoted as N+) and N-starved (denoted as N−) E. coli aligned against the upstream regions of a representative set of known ppGpp responsive promoters grouped into key cellular processes. A track with the input DNA control tag density (denoted as input) is shown for comparison. The screenshots in the green and red boxes denote promoters at which RNAp binding is positively and negatively, respectively, affected by ppGpp.

Comment in

References

    1. Reitzer L. Nitrogen assimilation and global regulation in Escherichia coli. Annu. Rev. Microbiol. 57, 155–176 (2003). - PubMed
    1. Zimmer D. P. et al. Nitrogen regulatory protein C-controlled genes of Escherichia coli: scavenging as a defense against nitrogen limitation. Proc. Natl Acad. Sci. USA 97, 14674–14679 (2000). - PMC - PubMed
    1. Jiang P. & Ninfa A. J. Regulation of autophosphorylation of Escherichia coli nitrogen regulator II by the PII signal transduction protein. J. Bacteriol. 181, 1906–1911 (1999). - PMC - PubMed
    1. Villadsen I. S. & Michelsen O. Regulation of PRPP and nucleoside tri and tetraphosphate pools in Escherichia coli under conditions of nitrogen starvation. J. Bacteriol. 130, 136–143 (1977). - PMC - PubMed
    1. Atkinson G. C., Tenson T. & Hauryliuk V. The RelA/SpoT homolog (RSH) superfamily: distribution and functional evolution of ppGpp synthetases and hydrolases across the tree of life. PLoS ONE 6, e23479 (2011). - PMC - PubMed

Publication types

MeSH terms