. 2014 Jul;141(14):2855-65.
doi: 10.1242/dev.106914. Epub 2014 Jun 19.

The cortical hem regulates the size and patterning of neocortex

Affiliations

The cortical hem regulates the size and patterning of neocortex

Giuliana Caronia-Brown et al. Development. 2014 Jul.

Abstract

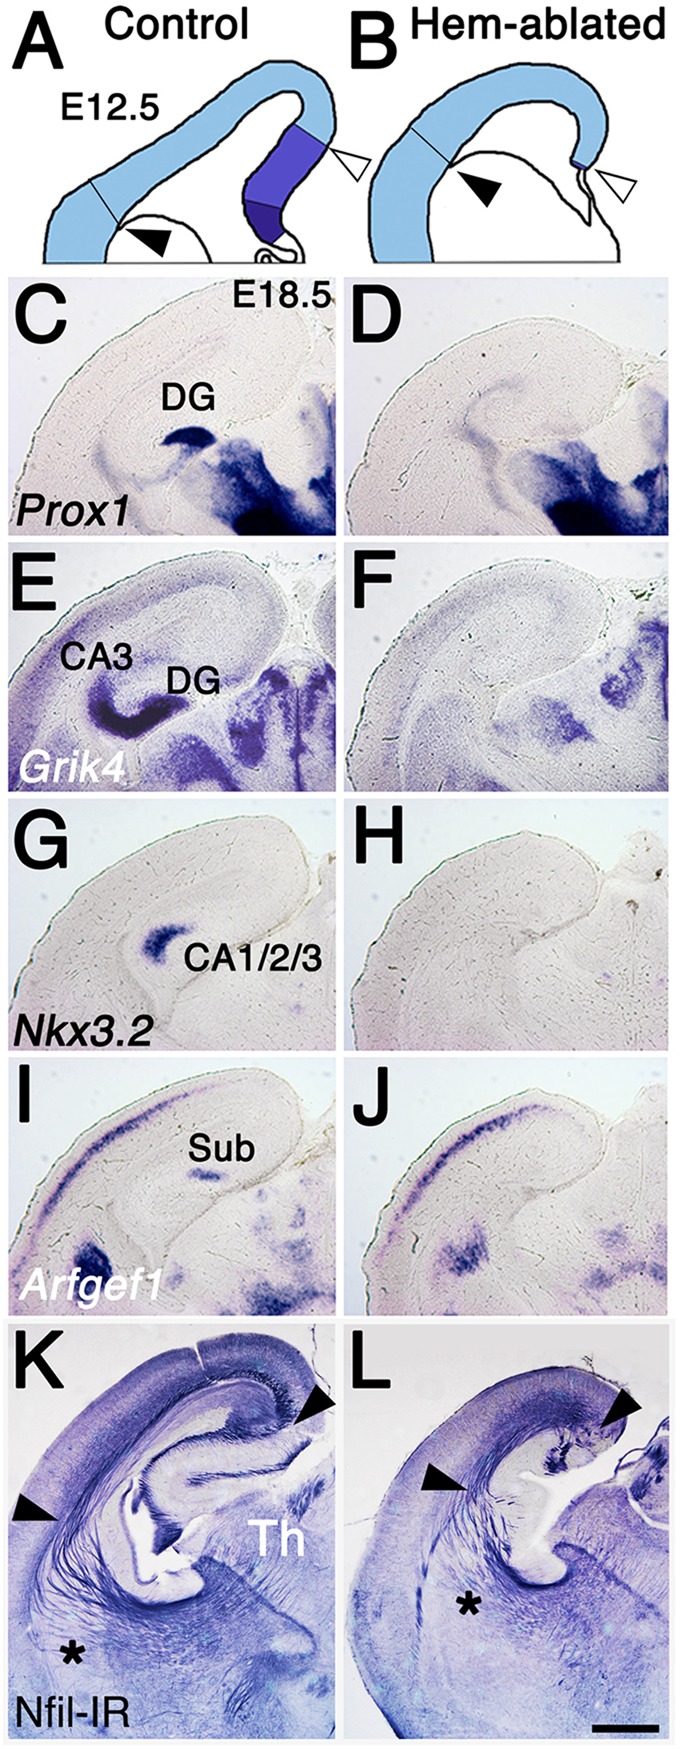
The cortical hem, a source of Wingless-related (WNT) and bone morphogenetic protein (BMP) signaling in the dorsomedial telencephalon, is the embryonic organizer for the hippocampus. Whether the hem is a major regulator of cortical patterning outside the hippocampus has not been investigated. We examined regional organization across the entire cerebral cortex in mice genetically engineered to lack the hem. Indicating that the hem regulates dorsoventral patterning in the cortical hemisphere, the neocortex, particularly dorsomedial neocortex, was reduced in size in late-stage hem-ablated embryos, whereas cortex ventrolateral to the neocortex expanded dorsally. Unexpectedly, hem ablation also perturbed regional patterning along the rostrocaudal axis of neocortex. Rostral neocortical domains identified by characteristic gene expression were expanded, and caudal domains diminished. A similar shift occurs when fibroblast growth factor (FGF) 8 is increased at the rostral telencephalic organizer, yet the FGF8 source was unchanged in hem-ablated brains. Rather we found that hem WNT or BMP signals, or both, have opposite effects to those of FGF8 in regulating transcription factors that control the size and position of neocortical areas. When the hem is ablated a necessary balance is perturbed, and cerebral cortex is rostralized. Our findings reveal a much broader role for the hem in cortical development than previously recognized, and emphasize that two major signaling centers interact antagonistically to pattern cerebral cortex.

Keywords: Embryonic patterning; Fgf8; Mouse; Neocortex; Signaling center; Wnt3a.


Figures

Fig. 1.
Fig. 1.
Reduced indicators of WNT and BMP signaling in hem-ablated cortex. (A-J) E12.5 mouse brains processed with in situ hybridization or immunohistochemistry. (A,B) Whole brains, dorsal view, rostral up, (C-J) coronal sections, medial to right. (A-D) Lef1 expression in hem-ablated CP is weaker and more confined than in a control E12.5 CP. White arrowheads (A,B) indicate comparable positions in the two brains. Black arrowheads indicate low point of M/L expression gradient (B-D). (E,F) Axin-IR is lower in hem-ablated than control CP (note intensity at arrowheads). (G,H) A similar density of pSMAD-IR VZ cells in control and hem-ablated CP. Insets show higher magnification. (I,J) Lhx2 expression is lower in hem-ablated than control CP. Scale bar: in J, 400 µm for A,B; 200 µm for C-F,I,J; 50 µm for G,H. CPe, choroid plexus epithelium.
Fig. 2.
Fig. 2.
Loss of hippocampus and reduced neocortex in hem-ablated mice. (A,B) Schematic coronal sections, control and hem-ablated E12.5 brains. Neocortical and hippocampal primordia, light and mid blue; hem is dark blue. Arrowheads point to the same anatomical landmarks in A,B as in K,L. Hem ablated-cortex lacks a hippocampus, and dorsal CP is shorter in B than in A. (C-L) Coronal sections through control (C,E,G,I,K) and hem-ablated (D,F,H,J,L) E18.5 brains processed with in situ hybridization (C-J) or immunohistochemistry to show Nfil-IR (K,L). (C-J) Hem-ablated brains lack gene expression indicating the dentate gyrus, CA3, CA1 and subiculum. (K,L) In hem-ablated brains, dorsal CP is shortened (arrowheads) and fewer axons cross between CP and thalamus (asterisks). Scale bar: in L, 400 µm for C-L. DG, dentate gyrus; Sub, subiculum; Th, thalamus.
Fig. 3.
Fig. 3.
Dorsomedial cortex is reduced and ventrolateral cortex expanded in hem-ablated mice. (A-J) Coronal sections, E18.5 cortex. (A-D) Strong expression of Cdh6 and Rorb shifts medially in hem-ablated mice (black arrowheads in A-D), demonstrating that a medial neocortical region (dotted lines, between white arrowheads in C) is reduced or lost. (E-F) A gap in Pou3f1 expression picks out the piriform area (black arrowheads) and is larger in the hem-ablated mouse. (G-J) Nrp2 expression indicates dorsal expansion of presumptive piriform (white curved lines, G,H), and entorhinal areas (arrowheads, I,J). Insular cortex lies within the Pou3f1 expression domain. Scale bar: in J, 400 µm for A-F,I,J; 200 µm for G,H. Am, amygdala; Icx, insular cortex; ER, entorhinal; Pir, piriform.
Fig. 4.
Fig. 4.
Caudal cortex is disproportionately reduced in hem-ablated mice. (A-D) Sagittal sections, E17.5 cortex. (A,B) Dense band of Ngfr expression marks pS1 and presumptive visual cortex (pV1); this band is much shorter caudal to rostral in hem-ablated cortex (black arrowheads in A,B). (C) In control cortex Lmo4 expression is strong in Fr and Oc domains, virtually absent in the Pa domain containing pS1. (D) In hem-ablated cortex, Lmo4 expression suggests a reduced Pa domain, and near obliteration of the Oc territory (arrowheads in C,D). Scale bar: in D, 400 µm for A-D.
Fig. 5.
Fig. 5.
Hem-ablated hemispheres display shifts in cortical domain boundaries. (A-J) E18.5 forebrains, processed with whole-mount in situ hybridization, dorsal (A,B,G,H) or lateral (C-F,I,J) view. Broken white lines (A,B) indicate the caudal boundary of neocortex, red arrowheads (C-F) mark its ventral boundary, and in E,F, neocortex is the dorsal region that does not express Nrp2. White or black arrowheads (E,F,I,J) mark the ventral edge of cortex. (A-D) Fr Lmo4 expression expands in hem-ablated neocortex, but Oc Lmo4 expression is severely diminished. (E,F) Nrp2 expression indicates expansion of ventrolateral cortex (Pir and ER). (G-H) Cdh6 expression shifts caudally and towards the midline (asterisks) in hem-ablated cortex. (I,J) In lateral view Cdh6 expression shifts dorsally. (K,L) Summary of regional size changes with hem ablation, neocortex is blue, ventrolateral cortex is yellow. Scale bar: in J, 500 µm for A-J.
Fig. 6.
Fig. 6.
Altered cell proliferation contributes to smaller dorsomedial cortex but not to other regional size changes. (A-D) Sagittal sections, E11.5 brains. (A,B) Sparse caspase-3-IR apoptotic cells in control and hem-ablated CP (white arrowheads), dense cells only in developing CPe (black arrowheads). (C,D) Less dense pHH3-IR apical progenitor cells in the dorsomedial CP of a hem-ablated brain compared with a control (see regions at asterisks). (E) pHH3-IR cell counts in caudal, central, rostral thirds of E11.5 CP. Two-way ANOVA indicated that mean cell counts, obtained from the six control and six hem-ablated brains, vary significantly by genotype and by R/C level, but not by the interaction of the two factors. Scale bar: in D, 100 µm for A,B; 40 µm for C,D.
Fig. 7.
Fig. 7.
Expression of genes implicated in cortical patterning. (A-D) Whole E11.5 brains, frontal view (A,B), whole E12.5 brains, dorsal view (C,D). (E-H) Coronal sections E12.5 brains. (A,B) Fgf8 expression at the RTO is not expanded in a hem-ablated brain compared with a control. (C,D) Emx2 expression gradients, caudal to rostral, and medial to lateral. In hem-ablated hemispheres, Emx2 expression is lower overall. A rostral zone with little or no Emx2 expression is larger than in controls (broken lines, brains on right, C,D). (E-H) Dmrt3 and Dmrta2 expression is reduced in hem-ablated brains compared with controls (arrowheads in E-H). Scale bar: in H, 400 µm for A,B; 1.5 mm for C,D; 300 µm for E-H. c, caudal; di, diencephalon; l, lateral; m, medial; r, rostral.
Fig. 8.
Fig. 8.
Opposite control of known patterning gene expression by WNT3a and FGF8. (A-F) Coronal sections through wild-type E12.5 CD-1 mouse brains, electroporated at E10.5 with a Wnt3a (A-D) or Fgf8 (E,F) expression construct and processed with in situ hybridization. Ectopic WNT3a upregulates expression of Emx2 (A,B) and Dmrt3 (C,D). Ectopic FGF8 downregulates Dmrta2 expression (E,F). Scale bar: in F, 300 µm for A-F.
Fig. 9.
Fig. 9.
WNT3a and FGF8 regulation of candidate patterning gene expression. (A-Q) Coronal sections through wild-type E12.5 CD-1 mouse brains, electroporated in one hemisphere at E10.5 with Wnt3a (Wnt3a e/p) or Fgf8 (Fgf8 e/p) and processed with in situ hybridization. (A-D) Wnt3a e/p (A) increases Lhx2 expression (B, compare expression between arrowheads in each hemisphere). Fgf8 e/p (C, arrowhead) expands a region of low Lhx2 expression (D, see arrowhead pairs). (E-L) Wnt3a e/p (E,G,I,K) reduces CP expression of Etv5,4 and 1 as well as Kitl (F,H,J,L, compare expression between arrowheads in each hemisphere). (M-Q) Fgf8 and Wnt3a e/p have opposite effects on expression of Sp5 (M-P), but Wnt3a e/p mimics FGF8 in upregulating Sp8 expression (Q). (O-Q) Control and e/p sides of the CP are shown in separate panels. Scale bar: in Q, 300 µm for A-F,I,J,M-Q; 200 µm for G,H,K,L.

References

    1. Agarwala S., Sanders T. A., Ragsdale C. W. (2001). Sonic hedgehog control of size and shape in midbrain pattern formation. Science 291, 2147-2150. 10.1126/science.1058624 - DOI - PubMed
    1. Arber S., Ladle D. R., Lin J. H., Frank E., Jessell T. M. (2000). ETS gene Er81 controls the formation of functional connections between group Ia sensory afferents and motor neurons. Cell 101, 485-498. 10.1016/S0092-8674(00)80859-4 - DOI - PubMed
    1. Armentano M., Chou S.-J., Tomassy G. S., Leingärtner A., O'Leary D. D. M., Studer M. (2007). COUP-TFI regulates the balance of cortical patterning between frontal/motor and sensory areas. Nat. Neurosci. 10, 1277-1286. 10.1038/nn1958 - DOI - PubMed
    1. Assimacopoulos S., Grove E. A., Ragsdale C. W. (2003). Identification of a Pax6-dependent epidermal growth factor family signaling source at the lateral edge of the embryonic cerebral cortex. J. Neurosci. 23, 6399-6403 - PMC - PubMed
    1. Assimacopoulos S., Kao T., Issa N. P., Grove E. A. (2012). Fibroblast growth factor 8 organizes the neocortical area map and regulates sensory map topography. J. Neurosci. 32, 7191-7201. 10.1523/JNEUROSCI.0071-12.2012 - DOI - PMC - PubMed

Publication types

MeSH terms

LinkOut - more resources