. 2014 Jun 20;344(6190):1384-9.
doi: 10.1126/science.1252079.

Controlling low rates of cell differentiation through noise and ultrahigh feedback

Affiliations

Controlling low rates of cell differentiation through noise and ultrahigh feedback

Robert Ahrends et al. Science. .

Abstract

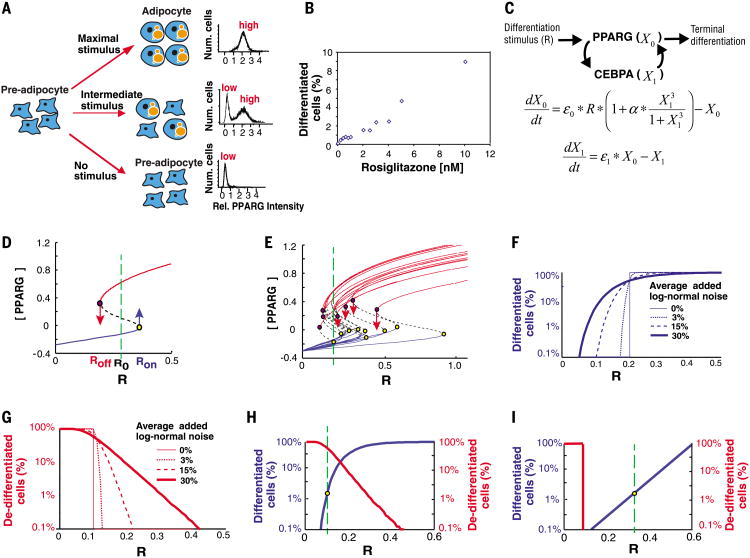
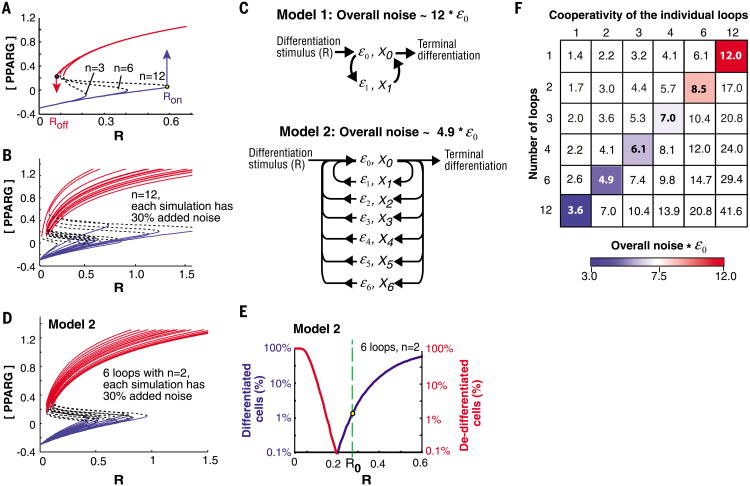
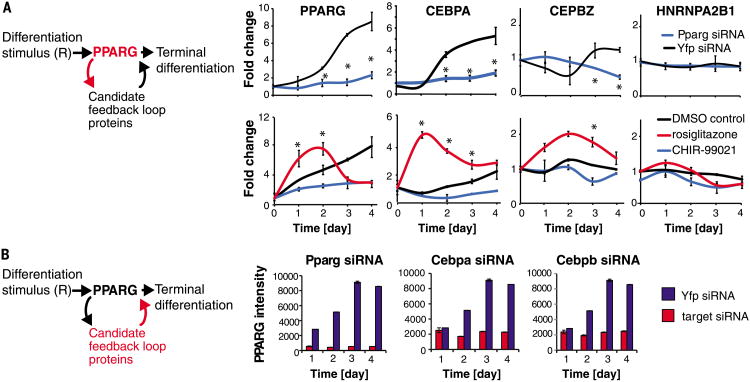
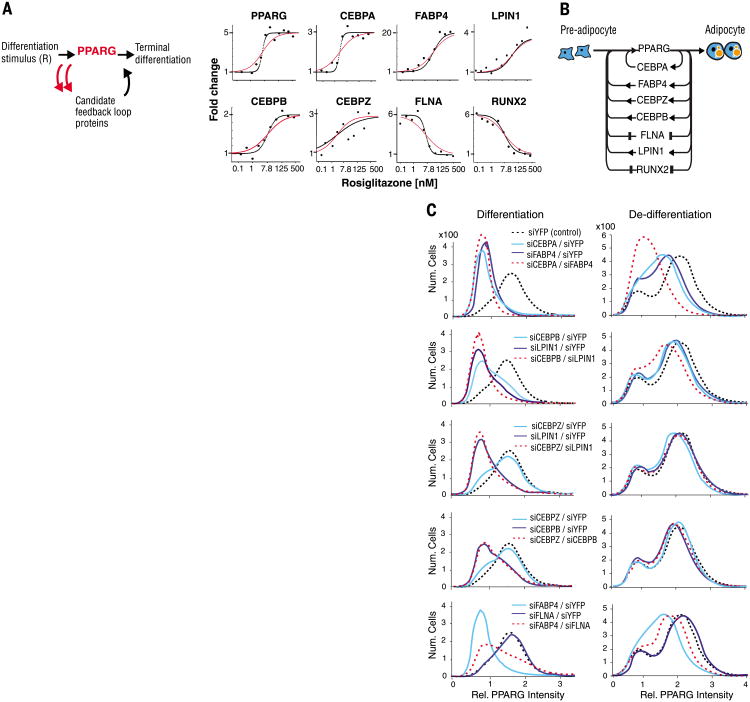
Mammalian tissue size is maintained by slow replacement of de-differentiating and dying cells. For adipocytes, key regulators of glucose and lipid metabolism, the renewal rate is only 10% per year. We used computational modeling, quantitative mass spectrometry, and single-cell microscopy to show that cell-to-cell variability, or noise, in protein abundance acts within a network of more than six positive feedbacks to permit pre-adipocytes to differentiate at very low rates. This reconciles two fundamental opposing requirements: High cell-to-cell signal variability is needed to generate very low differentiation rates, whereas low signal variability is needed to prevent differentiated cells from de-differentiating. Higher eukaryotes can thus control low rates of near irreversible cell fate decisions through a balancing act between noise and ultrahigh feedback connectivity.


Figures

Fig. 1
Fig. 1. Description of the control problem
(A) Schematic of the bistable switch from pre-adipocyte to adipocyte. Right, bimodality in single cell abundance of PPARG. (B) Control of very low rates of adipocyte differentiation by increasing the stimulus, R, applied to mouse OP9 preadipocyte cells. Here, R is rosiglitazone, a PPARG agonist, which directly induces adipogenesis in these cells (7). (C) Quantitative model of the protein network controlling the terminal differentiation decision in adipocytes. ε0 and ε1 represent noise in the abundance of X0 and X1, respectively, α is a feedback amplification term experimentally measured to be ∼15 (7). (D) Steady-state plot of a one-feedback loop system with cooperativity, n = 3. As the receptor stimulus R is increased, Ron is the level of R at which the modeled cell triggers into the differentiated state (yellow dot). As R is decreased, Roff is the level of R at which the cell loses the differentiated state (purple dot). R0 is the level of basal receptor activity. (E) Sample steady-state plots of the system in (D) but with 30% log-normal noise randomly added to each simulation. At the stimulus intensity marked by the green line, only one cell differentiated but several differentiated cells de-differentiated (red arrows). (Fand G) The relationship between Rand number of cells differentiating or de-differentiating becomes more graded as more noise is added. Each curve in these plots summarizes the Ron (F) or Roff (G) values obtained from 20,000 simulations. Noise was added randomly to each simulation to result in an average of no noise (thin solid line) up to 30% log-normal noise (thick solid line). (H) Plot showing the probabilities of triggering differentiation (blue) versus losing the differentiated state (red) as a function of the stimulus intensity R [20,000 simulations of the system described in (E)]. Such a system would be unable to maintain tissue size because, at the rate of preadipocyte differentiation observed in vivo (1.65%, as marked by dashed green line), ∼80% of adipocytes would de-differentiate. (I) Plot showing ideal condition which allows for graded control of low rates of differentiation but with no de-differentiation.
Fig. 2
Fig. 2. A protein architecture that can regulate a 10% annual renewal rate
(A) Steady-state plots when the cooperativity, n, is increased. (B) Sample steady-state plots for a system with a single high cooperative feedback loop (n = 12) and 30% log-normal noise added to each simulation. (C) Schematic of two system architectures that have the same overall cooperativity but different overall noise. Model 1 has one feedback loop with a cooperativity of 12. Model 2 has six positive feedback loops, each with a cooperativity of 2. (D and E) Simulation results for model 2. An average of 30% log-normal noise was randomly added to each simulation. (D) Sample steady-state curves. Plotting the curves with R on a log-scale shows that the variability in Ron and Roff is similar (fig. S1C). (E) Results of 20,000 simulations showing that such a system can maintain tissue size. At the low differentiation rate needed to renew adipose tissue (1.65%, yellow dot), less than 0.1% of differentiated cells would lose the differentiated state. (F) The matrix shows the overall system noise as a function of number of feedback loops versus cooperativity of the individual loops. The colored boxes mark systems with the same total cooperativity (n = 12), but with decreasing system noise as the number of feedback loops increases.
Fig. 3
Fig. 3. A method to systematically uncover feedback loops in a protein network
(A) SRM-MS was used to measure changes in nuclear protein concentrations over the timecourse of adipogenesis in response to siRNA or chemical perturbations to PPARG (see also figs. S10 to S12). OP9 preadipocytes were induced to differentiate into mature adipocytes in 4 days by addition of the adipogenic cocktail (dexamethasone, isobutylmethylxanthine, and insulin). (Top) Cells were transfected with siRNA targeting PPARG (blue) or yellow fluorescent protein (YFP) as a control (black) 24 hours before addition of the adipogenic factors. (Bottom) A PPARG agonist (rosiglitazone) or PPARG inhibitor (CHIR-99021) was added together with the adipogenic mix. All values were normalized to the control value at day 0. Each data point is the average of three biological replicates (error bars show standard deviation). A protein was classified as regulated by PPARG activity if its abundance in the perturbed versus control (YFP) samples varied significantly at one or more time points, P < 0.05 (*) calculated using the student's t test, two-tailed, two-sample equal variance. (B) siRNA-mediated depletion of the candidate feedback loop partners was used to determine which ones regulate PPARG. The knockdown effect in OP9 cells was measured by immunocytochemistry staining for PPARG. Each bar in the plots represents ∼10,000 cells. Error bars show standard error. See also fig. S13.
Fig. 4
Fig. 4. Differentiation from pre-adipocyte to adipocyte is regulated by a single module consisting of multiple positive-feedback loops connecting back to PPARG
(A) Test for feedback connectivity by directly activating PPARG. The PPARG agonist rosiglitazone was titrated into the medium of undifferentiated OP9 cells, and the protein abundance of the candidate feedback loop mediators was measured by SRM-MS 48 hours later, a time point at which PPARG is maximally expressed (7). Curves show the best fits to the data using an optimized Hill coefficient (black) versus a Hill coefficient of 1 (red). (B) Schematic of the seven identified feedback loops. (C) Contributions of the identified feedback loops to switching pre-adipocytes (low PPARG peak) to adipocytes (high PPARG peak) and to preventing de-differentiation. To measure contributions to differentiation, we transfected OP9 cells with siRNA 24 hours before the start of the experiment to remove the specified feedback loop components. The cells were then stimulated with 1 μM rosiglitazone for 24 hours and fixed (left column). To measure contributions to de-differentiation, OP9 cells were first differentiated into adipocytes by adding 1 μM rosiglitazone to the culture media for 48 hours, then transfected with the specified siRNA and fixed 24 hours later (right column). PPARG abundance was quantified by immunocytochemistry staining with anti-PPARG and then imaged.

References

    1. Zuber J, et al. Nature. 2011;478:524–528. - PMC - PubMed
    1. Tchoukalova YD, Sarr MG, Jensen MD. Am J Physiol. 2004;287:R1132. - PubMed
    1. Chawla A, Schwarz EJ, Dimaculangan DD, Lazar MA. Endocrinology. 1994;135:798–800. - PubMed
    1. Rosen ED, et al. Genes Dev. 2002;16:22–26. - PMC - PubMed
    1. Spalding KL, et al. Nature. 2008;453:783–787. - PubMed

Publication types

LinkOut - more resources