. 2014 Jun 18;34(25):8387-97.
doi: 10.1523/JNEUROSCI.1385-14.2014.

Adrenocortical status predicts the degree of age-related deficits in prefrontal structural plasticity and working memory

Affiliations

Adrenocortical status predicts the degree of age-related deficits in prefrontal structural plasticity and working memory

Rachel M Anderson et al. J Neurosci. .

Abstract

Cognitive decline in aging is marked by considerable variability, with some individuals experiencing significant impairments and others retaining intact functioning. Whereas previous studies have linked elevated hypothalamo-pituitary-adrenal (HPA) axis activity with impaired hippocampal function during aging, the idea has languished regarding whether such differences may underlie the deterioration of other cognitive functions. Here we investigate whether endogenous differences in HPA activity are predictive of age-related impairments in prefrontal structural and behavioral plasticity. Young and aged rats (4 and 21 months, respectively) were partitioned into low or high HPA activity, based upon averaged values of corticosterone release from each animal obtained from repeated sampling across a 24 h period. Pyramidal neurons in the prelimbic area of medial prefrontal cortex were selected for intracellular dye filling, followed by 3D imaging and analysis of dendritic spine morphometry. Aged animals displayed dendritic spine loss and altered geometric characteristics; however, these decrements were largely accounted for by the subgroup bearing elevated corticosterone. Moreover, high adrenocortical activity in aging was associated with downward shifts in frequency distributions for spine head diameter and length, whereas aged animals with low corticosterone showed an upward shift in these indices. Follow-up behavioral experiments revealed that age-related spatial working memory deficits were exacerbated by increased HPA activity. By contrast, variations in HPA activity in young animals failed to impact structural or behavioral plasticity. These data implicate the cumulative exposure to glucocorticoids as a central underlying process in age-related prefrontal impairment and define synaptic features accounting for different trajectories in age-related cognitive function.

Keywords: HPA axis; corticosterone; medial prefrontal cortex; prelimbic; working memory.


Figures

Figure 1.
Figure 1.
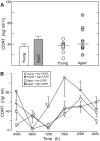
A, Mean + SEM for plasma CORT levels averaged across all six time points sampled (left), and plots of individual values (right). Although young and aged animals did not significantly differ in terms of overall adrenocortical activity, there exists a considerable degree of variability in glucocorticoid secretory output within each group. These differences provided the basis for dividing animals within each age category into subgroupings of high and low adrenocortical activity (horizontal line in each indicates the median value) for the assessment of age-related structural plasticity in mPFC as a function of this endocrine index. B, Mean ± SEM plasma CORT levels in young and aged animals as a function of HPA status sampled at 4 h intervals across the light-dark cycle. *p < 0.05, significantly different from low CORT animals. †p < 0.05, significantly different from both young and aged + low CORT subgroups. n = 6–7 per group.
Figure 2.
Figure 2.
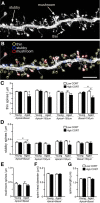
A, Example of a layer 2 PL pyramidal neuron iontophoretically filled with Lucifer yellow. The dashed circle demarcates the 150 μm boundary used to partition the dendritic tree for spine analyses. B, C, Deconvolved digital images of dendritic segments from different treatment groups. D, Mean + SEM of dendritic spine density as a function of treatment group. Disregarding differences in HPA status (left), aged animals (n = 14) show a significant reduction in overall spine density relative to young animals (n = 12). When aged and young animals are divided according to adrenocortical status (right), the aged + high CORT group exhibits a selective vulnerability for dendritic spine loss. E, Regional analyses show that dendrites throughout PL neurons are sensitive to spine loss as a function of aging and HPA status. Data represent mean + SEM for each group and are based on averages from each animal. *p < 0.05, significantly different for comparisons shown. †p < 0.05, significantly different from both young and aged + low CORT subgroups. n = 6–7 per group. Scale bar, B, C (in C), 5 μm.
Figure 3.
Figure 3.
Top, Example neuron in layer 3 of PL that was iontophoretically filled (left), and the rendering of its dendritic tree (right) using computer-assisted morphometry. The apical dendritic tree (green) is pointing upward, and basal dendrites (white) radiate from the opposite pole of the soma. Bottom, Histograms for dendritic length and number of branch endings for apical and basal dendrites. Aging or HPA status failed to result in any significant decreases in the dendritic indices examined. Data represent mean + SEM for each index and are based on overall averages from each animal (i.e., n = 6–7 animals/group; n = 1 arbor/neuron; n = 5 neurons/animal). Scale bar, 75 μm.
Figure 4.
Figure 4.
A, Example of high-resolution deconvolved optical z-stack of a dendritic segment used for spine analysis with NeuronStudio software. B, Open colored circles represent spine subtypes based upon user-defined parameters in the software (see Materials and Methods). Histograms represent the effects of aging and adrenocortical status on thin (C), stubby (D), mushroom (E), spine density, and (for all three subtypes) spine head diameter (F) and length (G). Aged animals bearing high adrenocortical activity showed selective losses in thin spines and, to a lesser extent, stubby spines in overall measures throughout the apical and basal dendritic tree. *p < 0.05, significantly different for comparison shown. †p < 0.05, significantly different from both young and aged + low CORT subgroups. n = 6–7 per group. Scale bar, both images, 5 μm.
Figure 5.
Figure 5.
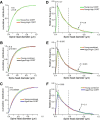
A–C, Cumulative frequency distributions of mushroom spine head diameters in PL neurons in young and aged subgroups. A, Comparisons between low and high CORT subgroups in young animals revealed no differences between these distributions, thus providing the rationale for treatment as one group for subsequent comparisons. B, The aged + high CORT group shows a leftward shift (i.e., decrease) in mushroom spine head diameter relative to young animals, whereas (C) aged + low CORT animals for this index show a cumulative frequency that is right-shifted (i.e., increased) relative to young animals, suggesting a mechanism leading to enlargement of mushroom spines relative to both young groups and aged + high CORT animals. K–S, Kolmogorov–Smirnov test. D–F, Frequency distributions for mushroom spine head diameter in PL pyramidal neurons in young and aged animals. The dashed vertical lines in each histogram indicate the 25th and 75th percentiles of the entire spine population. D, Comparisons between low and CORT subgroups in young animals. Because there were no differences between these distributions, subsequent analyses entailed combining these subgroups into one overall population. E, Comparisons between both young subgroups pooled together and aged + high CORT animals. Aged + high CORT animals show a shift in distribution toward a greater number of spines with small head diameters (lower quartile) and fewer spines with large head diameters (upper quartile) relative to young animals. F, Comparisons between both young subgroups pooled together and aged + low CORT animals. Aged + low CORT animals show a shift in distribution toward a greater number of spines with large head diameters (upper quartile) and fewer spines with smaller head diameters (lower quartile) relative to young animals. p values were obtained from the χ2 test for comparison of proportions of each distribution below or above the first or third quartile, respectively.
Figure 6.
Figure 6.
A, Mean + SEM for plasma CORT levels averaged across all six time points sampled (left), and plots of individual values (right). The horizontal lines indicate median values for each age group. B, Mean ± SEM plasma CORT levels in young (n = 10) and aged (n = 10) animals as a function of HPA status sampled at 4 h intervals across the light-dark cycle. *p < 0.05, significantly different from low CORT animals. †p < 0.05, significantly different from young + high CORT and both low CORT groups. n = 5 per group.
Figure 7.
Figure 7.
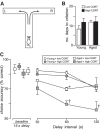
A, Schematic diagram of T maze (90 × 65 cm) used for delayed alternation. Rats are placed in the starting location (as shown) and were rewarded for selecting the opposite goal arm (e.g., right, R) from the previous trial (left, L). As the delay interval between each trial is increased, the percentage of correct choices provides a measure of spatial working memory. B, Histogram represents the average number of days that animals required to reach an equivalent level of performance in the delayed alternation task (>70% choice accuracy at a 15 s delay). C, Graph demonstrating the percentage of correct responses for baseline performance (i.e., at 15 s delay), and delayed alternation performance. Behavioral impairments were evident in the aged + high CORT group with respect to the other three groups at all three delay intervals (60, 120 s), whereas at the 60 s delay, aged + low CORT animals also showed a significant decrement in performance. Data represent mean ± SEM and are based on overall animal averages. *p < 0.05, significantly different from both young groups. †p < 0.05, significantly different from both young and aged + low CORT subgroups. n = 5 animals per group.

References

    1. Arnsten AF, Paspalas CD, Gamo NJ, Yang Y, Wang M. Dynamic network connectivity: a new form of neuroplasticity. Trends Cogn Sci. 2010;14:365–375. doi: 10.1016/j.tics.2010.05.003. - DOI - PMC - PubMed
    1. Barsegyan A, Mackenzie SM, Kurose BD, McGaugh JL, Roozendaal B. Glucocorticoids in the prefrontal cortex enhance memory consolidation and impair working memory by a common neural mechanism. Proc Natl Acad Sci U S A. 2010;107:16655–16660. doi: 10.1073/pnas.1011975107. - DOI - PMC - PubMed
    1. Baxter MG, Gallagher M. Neurobiological substrates of behavioral decline: models and data analytic strategies for individual differences in aging. Neurobiol Aging. 1996;17:491–495. doi: 10.1016/0197-4580(96)00011-5. - DOI - PubMed
    1. Bloss EB, Janssen WG, McEwen BS, Morrison JH. Interactive effects of stress and aging on structural plasticity in the prefrontal cortex. J Neurosci. 2010;30:6726–6731. doi: 10.1523/JNEUROSCI.0759-10.2010. - DOI - PMC - PubMed
    1. Bloss EB, Janssen WG, Ohm DT, Yuk FJ, Wadsworth S, Saardi KM, McEwen BS, Morrison JH. Evidence for reduced experience-dependent dendritic spine plasticity in the aging prefrontal cortex. J Neurosci. 2011;31:7831–7839. doi: 10.1523/JNEUROSCI.0839-11.2011. - DOI - PMC - PubMed

Publication types

LinkOut - more resources