. 2014 Jun 18;34(25):8432-48.
doi: 10.1523/JNEUROSCI.1105-14.2014.

Balanced mTORC1 activity in oligodendrocytes is required for accurate CNS myelination

Affiliations

Balanced mTORC1 activity in oligodendrocytes is required for accurate CNS myelination

Frédéric Lebrun-Julien et al. J Neurosci. .

Abstract

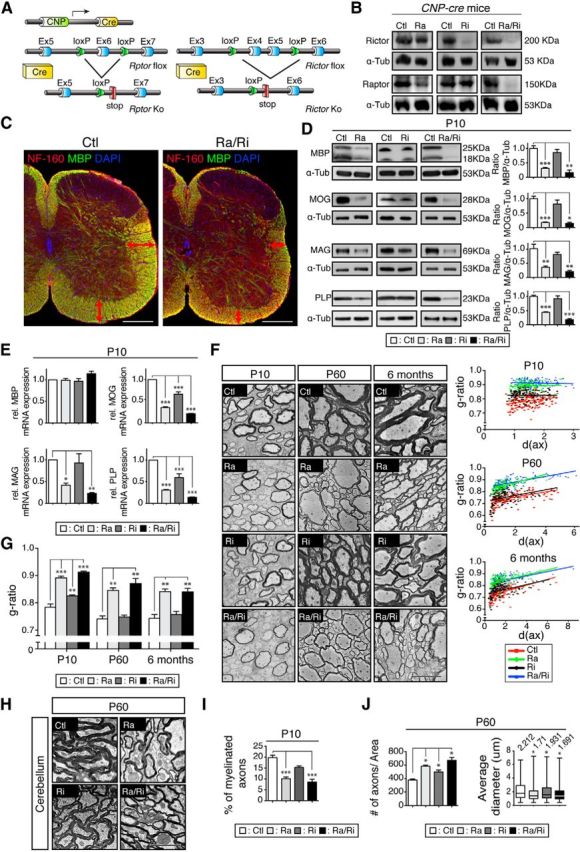
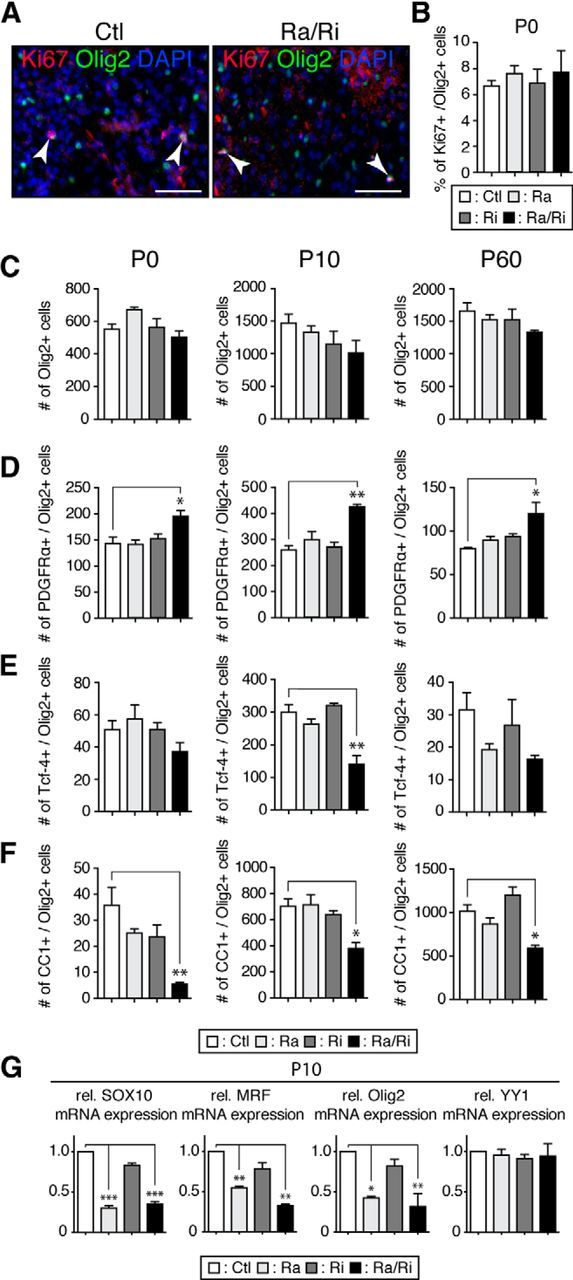
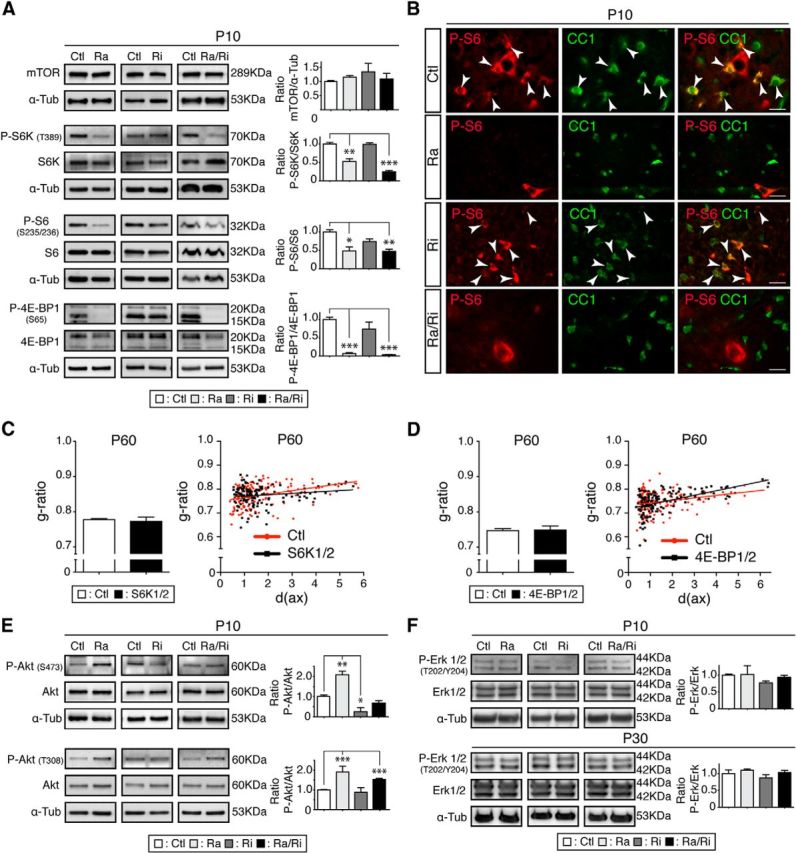
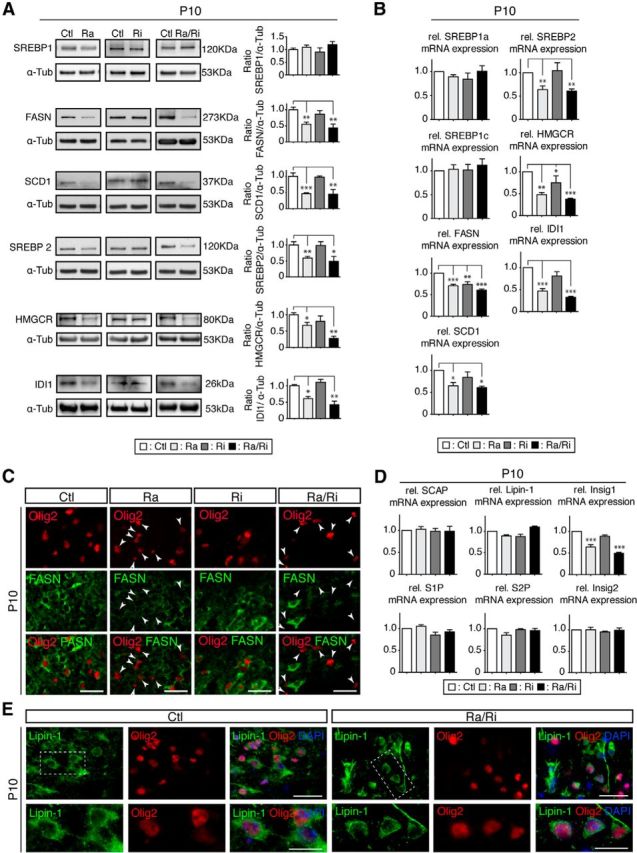
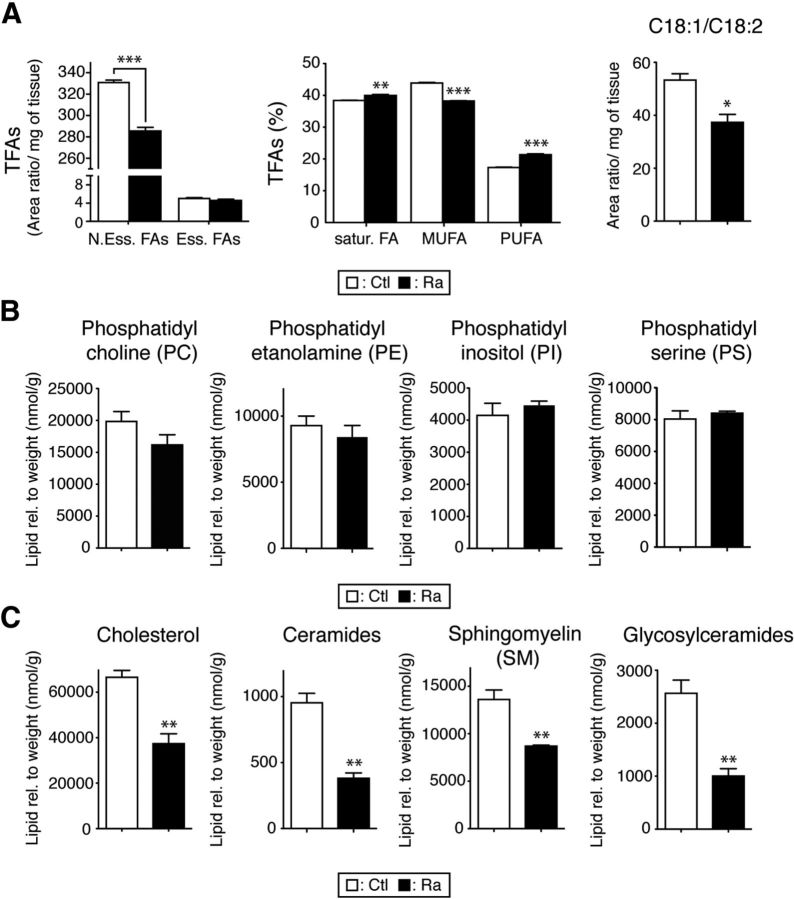
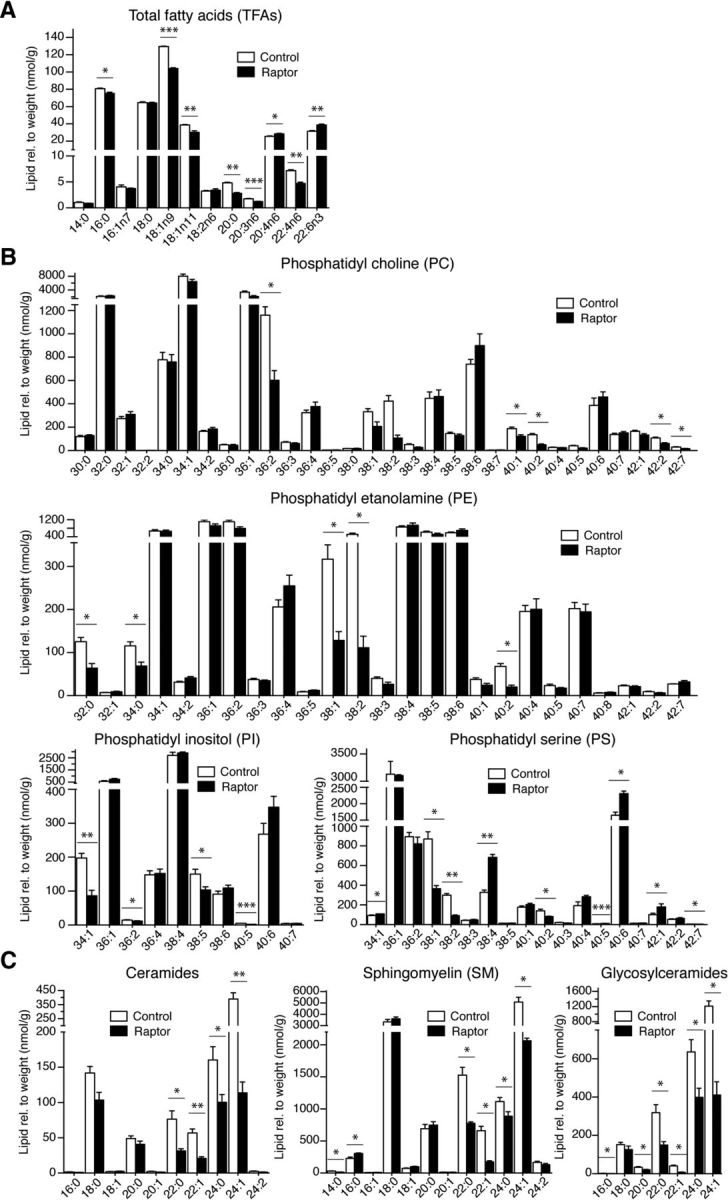
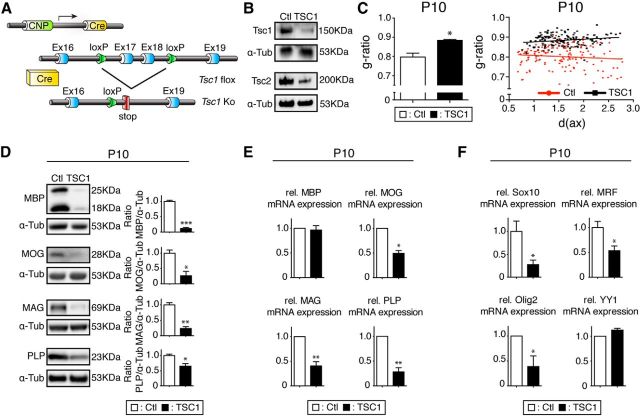
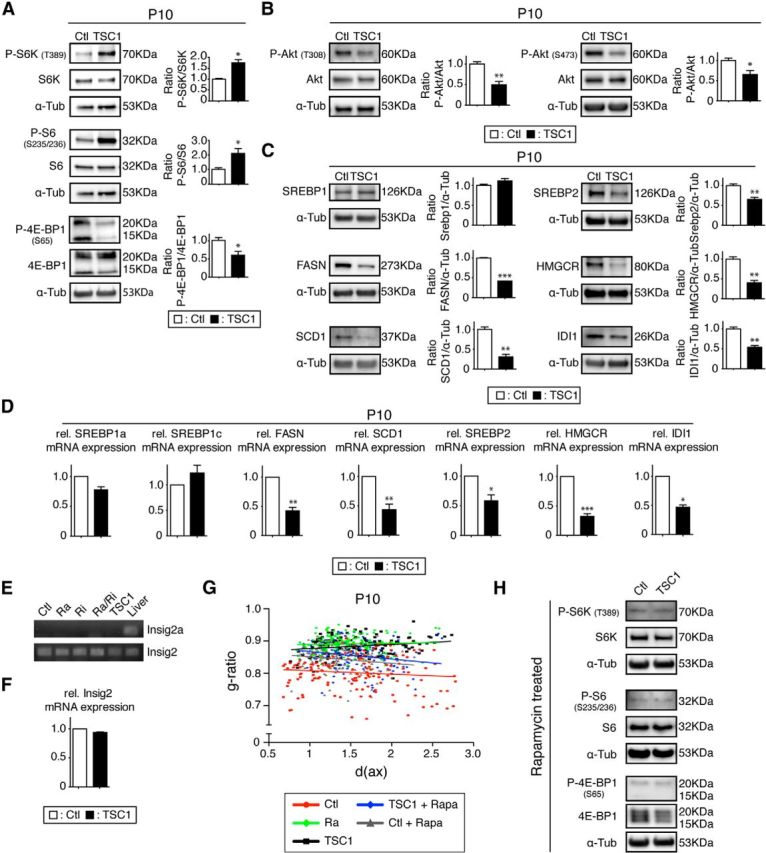
The mammalian target of rapamycin (mTOR) pathway integrates multiple signals and regulates crucial cell functions via the molecular complexes mTORC1 and mTORC2. These complexes are functionally dependent on their raptor (mTORC1) or rictor (mTORC2) subunits. mTOR has been associated with oligodendrocyte differentiation and myelination downstream of the PI3K/Akt pathway, but the functional contributions of individual complexes are largely unknown. We show, by oligodendrocyte-specific genetic deletion of Rptor and/or Rictor in the mouse, that CNS myelination is mainly dependent on mTORC1 function, with minor mTORC2 contributions. Myelin-associated lipogenesis and protein gene regulation are strongly reliant on mTORC1. We found that also oligodendrocyte-specific overactivation of mTORC1, via ablation of tuberous sclerosis complex 1 (TSC1), causes hypomyelination characterized by downregulation of Akt signaling and lipogenic pathways. Our data demonstrate that a delicately balanced regulation of mTORC1 activation and action in oligodendrocytes is essential for CNS myelination, which has practical overtones for understanding CNS myelin disorders.

Keywords: TSC1; TSC2; mTOR; myelin; oligodendrocytes; tuberous sclerosis.


Figures

Figure 1.
Figure 1.
Myelination deficiencies due to mTORC1 or mTORC2 inactivation. A, Regulatory elements of the CNP promoter drive the expression of Cre in oligodendrocytes. Schematics map of the Rptor and Rictor allele depicts the location of the loxP sequences. B, Microdissected fragments of the spinal cord white matter were analyzed by Western blot to confirm the loss of raptor and/or rictor in the conditional knock-out tissue. C, Transverse sections of the spinal cord from P10 raptor/rictor mutants and littermate controls were immunolabeled for MBP (green), neurofilament 160 (red), and DAPI (blue). White matter area is reduced in raptor/rictor mutant with lower density of MBP staining (red double-sided arrows). Scale bar, 200 μm D, Western blot analysis of spinal cord lysates shows a striking reduction of the myelin proteins MBP, MOG, MAG, and PLP in raptor and raptor/rictor mutants when normalized to α-tubulin. E, Levels of transcripts encoding myelin proteins analyzed by qRT-PCR reveal significant reductions of MOG and PLP in all mutants, reduced MAG expression in raptor and raptor/rictor mutants, and no difference for MBP in any mutants. F, EM micrographs of the ventral funiculus of spinal cords showing thinner myelin in the raptor/rictor and raptor mutants at all ages examined (P10, P60, 6 months). Shown are scatter plots of the g-ratios of individual fibers in relation to respective axon diameters (in micrometers) quantified at P10, P60, and 6 months from raptor/rictor (blue triangles), raptor (green diamonds), rictor (black circles), and littermate controls (red squares). Scale bars, 5 μm. G, Average g-ratios at P10, P60, and 6 months. Rictor mutants displayed a minor deficit in myelin thickness (higher g-ratio) at P10, which recovered at P60 and 6 months. H, EM micrographs of the cerebellum show thinner myelin in raptor/rictor and raptor mutants at P60. Scale bar, 2.5 μm. I, Percentage of myelinated fibers in the ventral spinal cord funiculus was reduced in raptor and raptor/rictor mutants. Error bars represent SEM. n = 3; *p < 0.05; **p < 0.01; ***p < 0.001. J, Quantification of axon number and axonal diameter per defined area (45 × 45 μm) of the spinal cord ventral funiculus on cross-sections stained with toluidine blue. Axons with diameter <0.4 μm were excluded.
Figure 2.
Figure 2.
Ablation of raptor/rictor affects OPC maturation. A, Immunostaining for the cell proliferation marker Ki67 combined with Olig2 staining on spinal cord transverse sections of P0 raptor/rictor mutants showed no difference compared with controls. Arrowheads indicate double-labeled cells. Scale bars, 50 μm B, Percentage of Ki67-positive cells/Olig-2 positive cells did not significantly differ among mutants and controls. CF, Transverse spinal cord sections at the junction of thoracic and lumbar vertebrae (T13–L1) were used to count total numbers of cells of the oligodendrocyte lineage (Olig2 staining; C), OPCs (PDGFRα/Olig2 staining; D), premyelinating oligodendrocytes (Tcf-4/Olig2 staining; E), and mature oligodendrocytes (CC1/Olig2 staining; F) at P0, P10, and P60. All mutants showed the same number of oligodendrocyte lineage cells. Only double mutants (raptor/rictor) exhibited negative effects on OPC maturation (higher number of PDGFR+ cells, lower number of CC1+ cells at all time points). Three sections each from three mice of each genotype were analyzed. G, qRT-PCR for the transcription factors SOX 10, MRF, and Olig2 showed a striking reduction in spinal cords of raptor/rictor and raptor mutant. YY1 mRNA did not change in any mutants. Error bars represent SEM. n = 3; *p < 0.05; **p < 0.01; ***p < 0.001.
Figure 3.
Figure 3.
Role of mTORC1 and mTORC2 in myelin maintenance. A, PLP1 gene regulatory elements drive expression of a tamoxifen-activatable Cre fusion protein in oligodendrocytes. Schematic map of raptor and rictor alleles depicts the location of loxP sequences. Upon Cre-mediated recombination after tamoxifen injection, the genomic region located between loxP sites is excised, thereby inactivating the conditional raptor or rictor alleles. B, Outline of the experimental procedure: raptor, raptor/rictor, and rictor mutants carrying the PLP1-CreRT2 allele and their littermate controls were injected with tamoxifen for 5 consecutive days at 2 months of age and killed for analysis 12 months later. C, Microdissected fragments of the spinal cord white matter were analyzed by Western blot to confirm loss of targeted raptor and/or rictor in the conditional knock-out mice. D, g-ratio values for raptor mutants showed a small but significant increase compared with control. The raptor/rictor mutant display a strikingly higher average g-ratio compared with both controls and single raptor mutants. Scatter plot graphics of single fiber g-ratio measurements versus axonal diameter (in micrometers) detailing the myelin thickness among mutants and controls. Shown are raptor/rictor (blue triangles), raptor (green diamonds), rictor (black circles), and their littermate controls (red squares). E, Representative electron micrographs of the spinal cord ventral funiculus showing thinner myelin of raptor/rictor mutants and the minor effect in raptor mutants. Scale bars, 2.5 μm. Error bars indicate SEM. n = 3; **p < 0.01; ***p < 0.001. F, Quantification of axonal diameters per defined area of the spinal cord ventral funiculus on cross-sections stained with toluidine blue. Axons with diameter <0.4 μm were excluded. The average axonal diameter was lower in all mutants. Error bars indicate SEM. n = 3; *p < 0.05; **p < 0.01; ***p < 0.001.
Figure 4.
Figure 4.
mTOR signaling pathway in raptor, rictor, and raptor/rictor mutants. A, Spinal cord lysates of raptor, rictor, and raptor/rictor mutants and littermate controls were analyzed by immunoblotting to detect mTOR protein and phosphorylation levels of the main mTORC1 targets: P-S6K (T389), P-S6 (S235/236), and P-4E-BP1 (S65). B, Immunostaining on spinal cord transverse sections revealed loss of P-S6 (red) in oligodendrocytes (marked by CC1; green) in raptor and raptor/rictor mutants, but not in rictor mutants and controls. Arrowheads indicate double-labeled cells. Scale bars, 20 μm. C, g-ratio values did not differ in S6K1/2 double-mutant animals compared with their littermate controls. Scatter plot graphics showing individual measurements of g-ratios versus axonal diameter (in micrometers) for S6K1/2 double mutants (black squares) and their littermate controls (red circles). D, Analogous analysis and outcome for 4E-BP1/2 double mutants as in C. Black squares, 4E-BP1/2; red circles, controls. Error bars indicate SEM. n = 3; *p < 0.05. E, Western blot analysis of the phosphorylation state of Akt at T308 or S473. F, Western blot analysis revealed no change of phosphorylation levels of Erk1/2 at P10 or P30, indicating no shift toward the Erk1/2-mitogen-activated protein kinase (MAPK) pathway. Error bars indicate SEM. n = 3; *p < 0.05; **p < 0.01; ***p < 0.001.
Figure 5.
Figure 5.
mTORC1 regulates lipogenesis via SREBP transcription factors. A, Western blot analysis of protein levels of SREBPs and their main targets in raptor, rictor, and raptor/rictor mutants. SREBP1 protein levels showed no change, whereas while its targets, FASN and SCD1, were reduced in raptor and raptor/rictor mutants. The same mutants showed a reduction at the protein level for SREBP2 and its targets HMGCR and IDI1. B, qRT-PCR of SREBPS and their main targets. C, Transverse sections of spinal cords revealed reduced staining for FASN (green) in oligodendrocyte lineage cells (Olig2+, red) in raptor and raptor/rictor mutants. Arrowheads indicate cells positive for Olig2 and negative for FASN. Scale bars, 25 μm. Error bars indicate SEM. n = 3; *p < 0.05; **p < 0.01; ***p < 0.001. D, Quantification of mRNA levels of key elements responsible for the maturation of the SREBPs did not display significant changes compared with controls, except for Insig1, a target of SREBPs, in raptor and raptor/rictor mutants. E, Transverse sections of spinal cords double-labeled for Lipin-1 (green) and the oligodendrocyte lineage marker Olig2 (red) shows no detectable nuclear localization of Lipin-1 in raptor/rictor mutants and no difference in the subcellular localization of Lipin-1 compared with controls. Scale bars, 50 μm.
Figure 6.
Figure 6.
Abnormal lipid composition in raptor mutant spinal cords. A, Quantification of total FAs (TFAs) showed a significant reduction of nonessential FAs (N.Ess.FAs) in raptor mutants, whereas the level of essential FAs (Ess.FAs) did not change. Percentage of saturated, monounsaturated, and polyunsaturated FAs indicated a shift from monounsaturated to polyunsaturated FAs. The ratio of 18:1/18:2, relatively high in normal myelin, was reduced in mutants. B, Phosphatidyl choline, phosphatidyl ethanolamine, phosphatidyl inositol, and phosphatidyl serine levels showed no change between controls and mutants. C, Cholesterol, ceramides, sphingomyelin, and glycosylceramides were strongly reduced in mutant spinal cords. Lipid species were normalized to the weight of the sample. Error bars indicate SEM. n = 4; *p < 0.05; **p < 0.01; ***p < 0.001.
Figure 7.
Figure 7.
Lipid species analysis of the raptor mutant spinal cords. A, Quantification of the total FA (TFA) species. B, Quantification of the individual lipid species phosphatidyl choline, phosphatidyl ethanolamine, phosphatidyl inositol, and phosphatidyl serine of raptor mutants compared with littermate controls. C, Quantification of the individual lipid species ceramides, sphingomyelin, and glycosylceramides in raptor mutants. Lipid species were normalized to sample weight. Error bars indicate SEM. n = 3; *p < 0.05; **p < 0.01; ***p < 0.001.
Figure 8.
Figure 8.
Overactivation of mTORC1 caused by TSC1 ablation leads to hypomyelination. A, Regulatory elements of the CNP promoter drive the expression of Cre in oligodendrocytes. Schematics map of the TSC1 allele depicts the location of loxP sequences. B, Microdissected fragments of the spinal cord white matter were analyzed by Western blot to confirm TSC1 loss in conditional knock-outs. C, Higher g-ratio values of TSC1 mutants in the spinal cord ventral funiculi indicate hypomyelination compared with controls. Shown are scatter plot graphics of single fiber measurements detailing the thinner myelin in TSC1 mutants (black squares) compared with littermate controls (red circles). D, Spinal cord lysates of TSC1 mutants revealed strongly reduced levels of the myelin proteins MBP, MOG, MAG, and PLP. E, qRT-PCR revealed reduced levels of the myelin proteins MOG, MAG, and PLP in the TSC1 mutants compared with controls, whereas MBP was unchanged. F, qRT-PCR of transcripts encoding SOX 10, MRF, and Olig2 showed significant reductions in the spinal cord of TSC1 mutants. YY1 mRNA levels did not change.
Figure 9.
Figure 9.
TSC1 mutant analysis. A, Phosphorylation levels of mTORC1 downstream targets P-S6K (T389) and P-S6K (S235/236) were strongly upregulated, except for P-4E-BP1 (S65), which was reduced. B, Phosphorylation of Akt was decreased on both T308 and S473. C, As in the raptor mutants, protein levels of main targets of SREBP and SREBP2 itself were reduced in mutants. D, qRT-PCR of the SREBPs and their main targets. E, RT-PCR for Insig2a and Insig2 in raptor, rictor, raptor/rictor, TSC1 mutant, and control spinal cords compared with liver positive control (ethidium-bromide-stained agarose gel). F, qRT-PCR of Insig2 in TSC1 mutants and control spinal cords. Error bars indicate SEM. n = 3; *p < 0.05; **p < 0.01; ***p < 0.001. G, Scatter plot graphics of g-ratios versus diameter of axons (in micrometers) of animal treated with rapamycin from P3 to P10. Shown are controls (gray triangles) and TSC1 mutants (blue diamonds) compared with control animals (red circles), raptor mutants (green diamonds), and TSC1 mutants (black squares) without treatment. Error bars indicate SEM. n = 3; *p < 0.05; **p < 0.01; ***p < 0.001. H, Spinal cord samples of rapamycin-treated TSC1 mutants and littermate controls showed the same downregulation of the main mTORC1 downstream targets.

Similar articles

Cited by

References

    1. Aksamitiene E, Kiyatkin A, Kholodenko BN. Cross-talk between mitogenic Ras/MAPK and survival PI3K/Akt pathways: a fine balance. Biochem Soc Trans. 2012;40:139–146. doi: 10.1042/BST20110609. - DOI - PubMed
    1. Ando S, Tanaka Y, Toyoda Y, Kon K. Turnover of myelin lipids in aging brain. Neurochem Res. 2003;28:5–13. doi: 10.1023/A:1021635826032. - DOI - PubMed
    1. Bentzinger CF, Romanino K, Cloëtta D, Lin S, Mascarenhas JB, Oliveri F, Xia J, Casanova E, Costa CF, Brink M, Zorzato F, Hall MN, Rüegg MA. Skeletal muscle-specific ablation of raptor, but not of rictor, causes metabolic changes and results in muscle dystrophy. Cell Metab. 2008;8:411–424. doi: 10.1016/j.cmet.2008.10.002. - DOI - PubMed
    1. Bentzinger CF, Lin S, Romanino K, Castets P, Guridi M, Summermatter S, Handschin C, Tintignac LA, Hall MN, Rüegg MA. Differential response of skeletal muscles to mTORC1 signaling during atrophy and hypertrophy. Skelet Muscle. 2013;3:6. doi: 10.1186/2044-5040-3-6. - DOI - PMC - PubMed
    1. Bercury KK, Dai J, Sachs HH, Ahrendsen JT, Wood TL, Macklin WB. Conditional ablation of raptor or rictor has differential impact on oligodendrocyte differentiation and CNS myelination. J Neurosci. 2014;34:4466–4480. doi: 10.1523/JNEUROSCI.4314-13.2014. - DOI - PMC - PubMed

Publication types

Substances