. 2014 Jun 18;34(25):8488-98.
doi: 10.1523/JNEUROSCI.0391-14.2014.

Differential longitudinal changes in cortical thickness, surface area and volume across the adult life span: regions of accelerating and decelerating change

Affiliations

Differential longitudinal changes in cortical thickness, surface area and volume across the adult life span: regions of accelerating and decelerating change

Andreas B Storsve et al. J Neurosci. .

Abstract

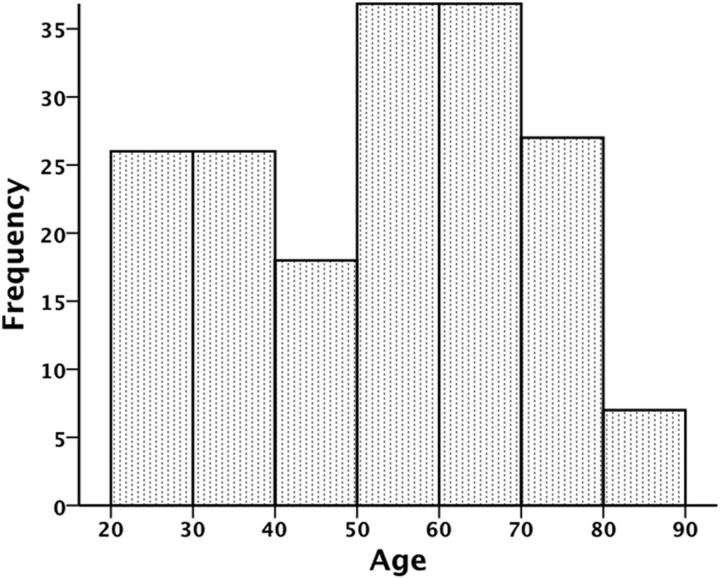
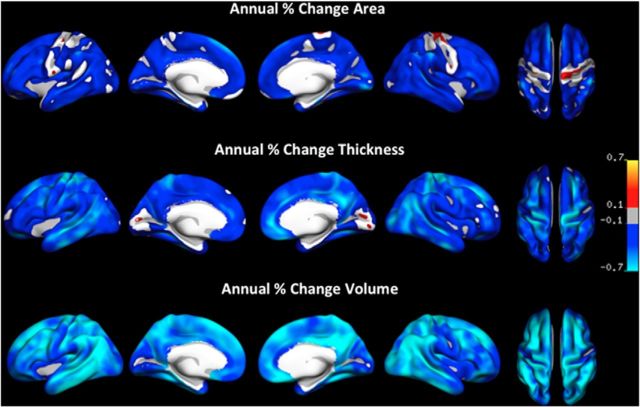
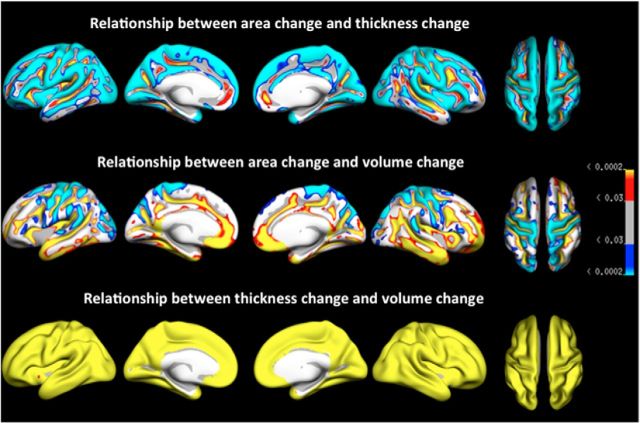
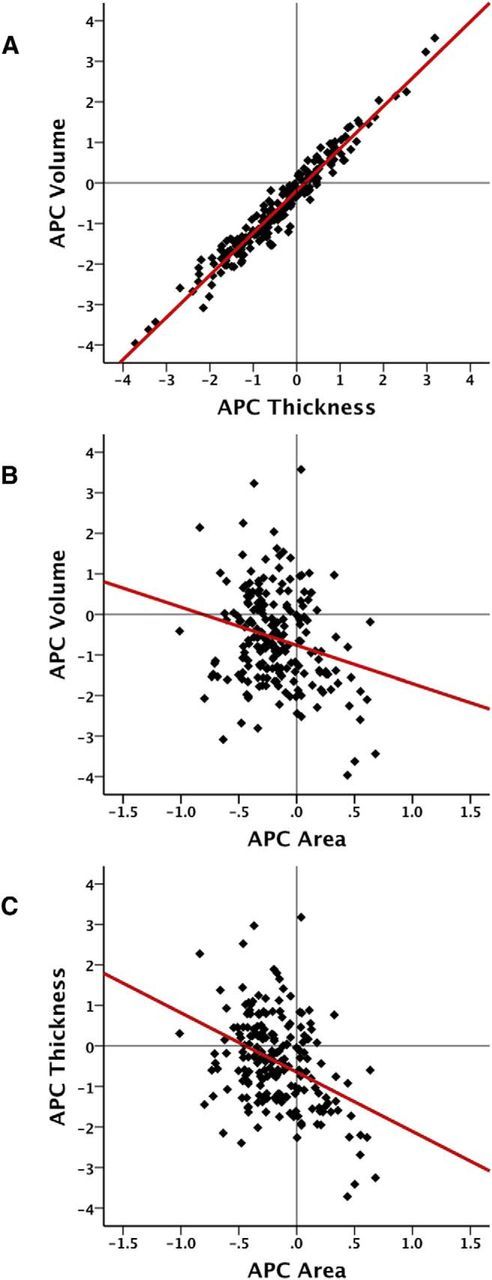
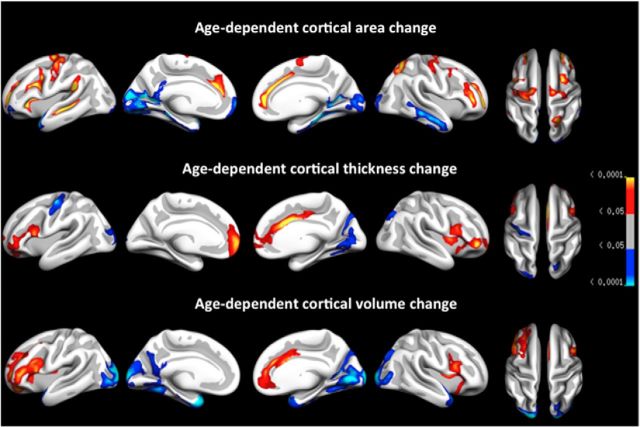
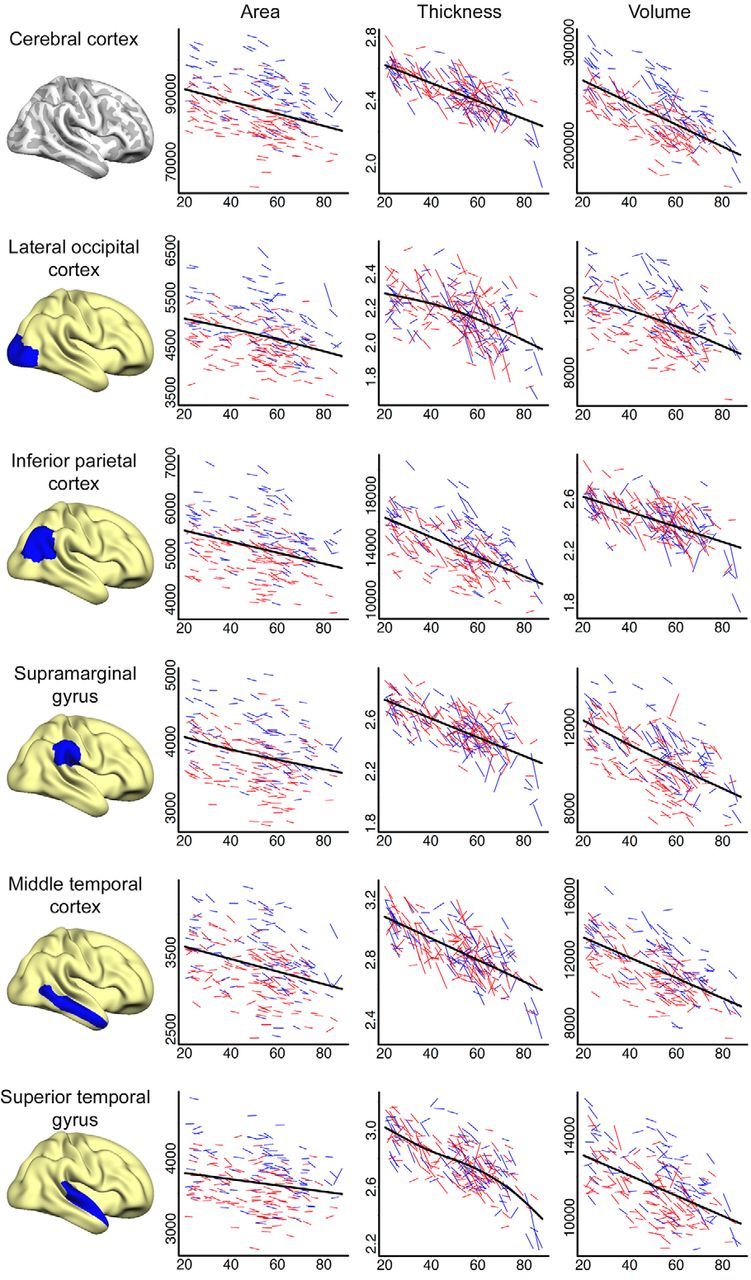
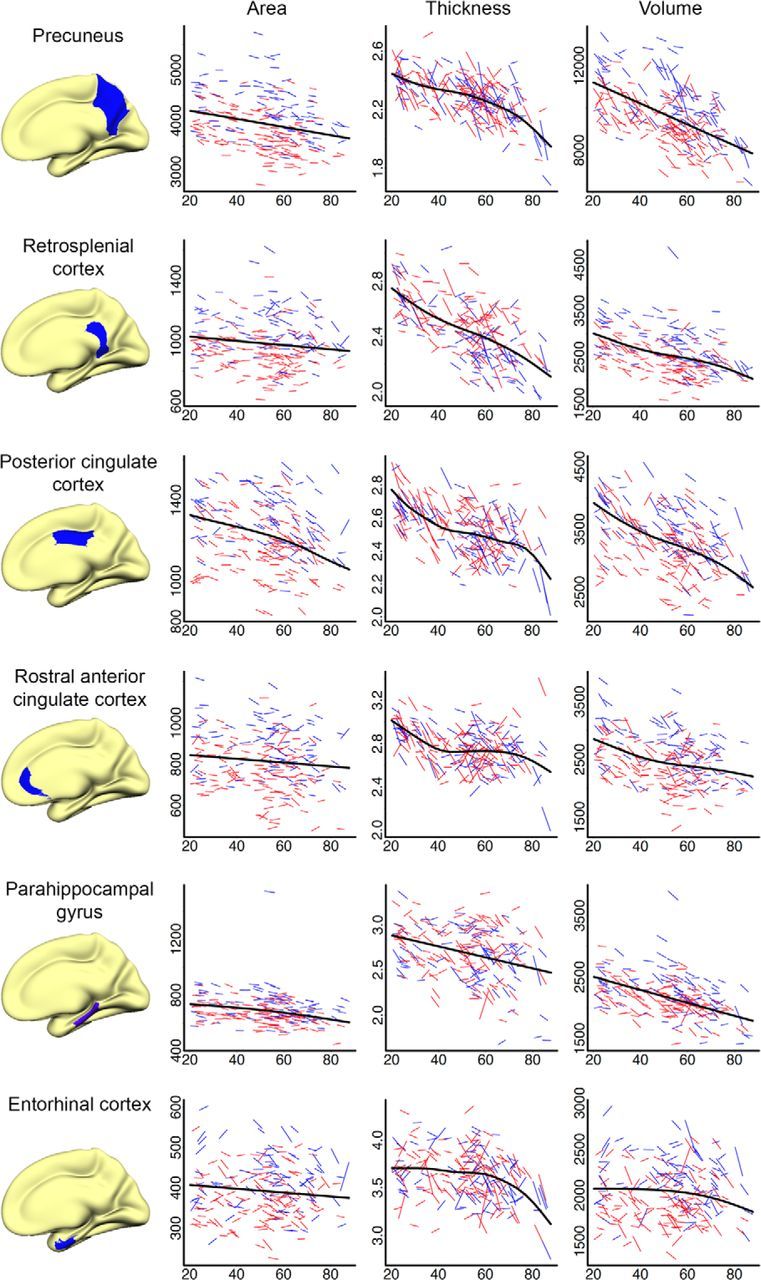
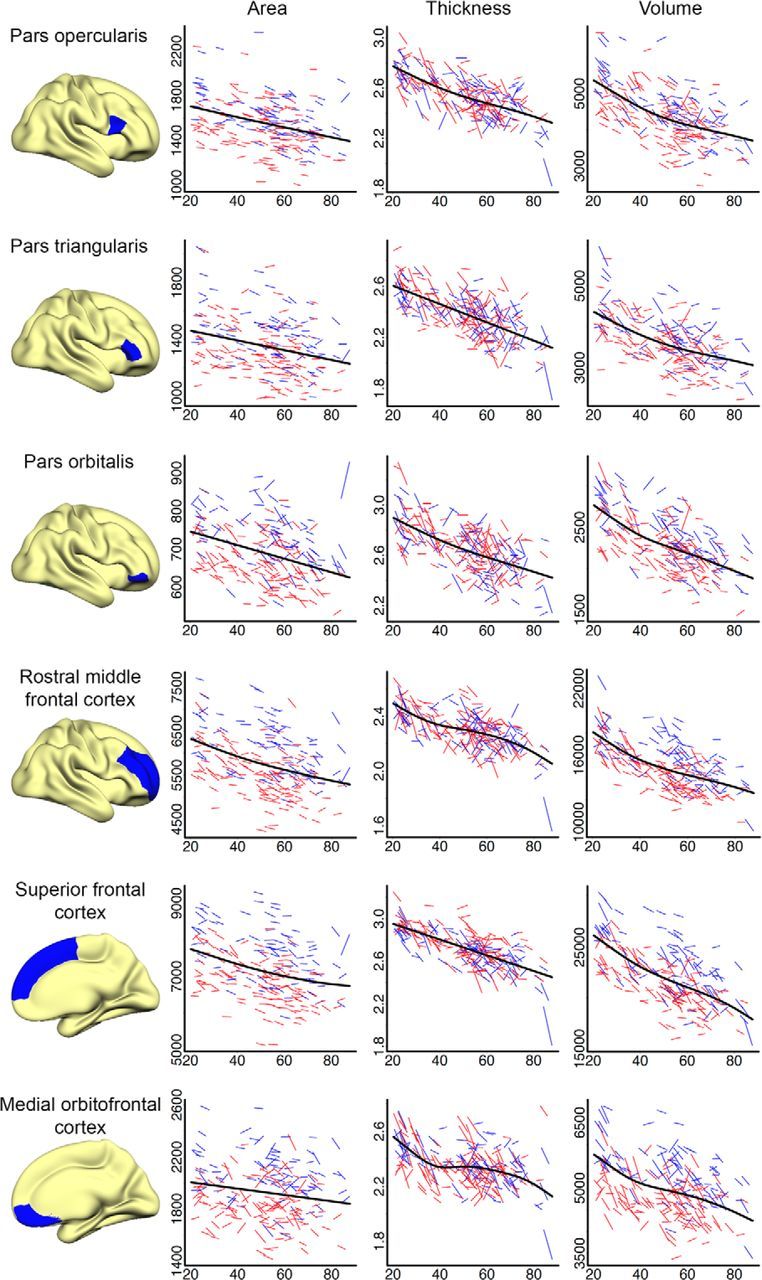
Human cortical thickness and surface area are genetically independent, emerge through different neurobiological events during development, and are sensitive to different clinical conditions. However, the relationship between changes in the two over time is unknown. Additionally, longitudinal studies have almost invariably been restricted to older adults, precluding the delineation of adult life span trajectories of change in cortical structure. In this longitudinal study, we investigated changes in cortical thickness, surface area, and volume after an average interval of 3.6 years in 207 well screened healthy adults aged 23-87 years. We hypothesized that the relationships among metrics are dynamic across the life span, that the primary contributor to cortical volume reductions in aging is cortical thinning, and that magnitude of change varies with age and region. Changes over time were seen in cortical area (mean annual percentage change [APC], -0.19), thickness (APC, -0.35), and volume (APC, -0.51) in most regions. Volume changes were primarily explained by changes in thickness rather than area. A negative relationship between change in thickness and surface area was found across several regions, where more thinning was associated with less decrease in area, and vice versa. Accelerating changes with increasing age was seen in temporal and occipital cortices. In contrast, decelerating changes were seen in prefrontal and anterior cingulate cortices. In conclusion, a dynamic relationship between cortical thickness and surface area changes exists throughout the adult life span. The mixture of accelerating and decelerating changes further demonstrates the importance of studying these metrics across the entire adult life span.

Keywords: aging; area; cortex; thickness; trajectory; volume.


Figures

Figure 1.
Figure 1.
Histogram displaying the age distribution at Tp2 in the current sample.
Figure 2.
Figure 2.
Annual percentage change in cortical area, thickness, and volume, shown on the same scale to highlight variations in change magnitude across the three measures. Only effects that survived FDR correction for multiple comparisons at the 0.05 level are displayed. Blue-cyan reflects decreases in area/thickness/volume and red-yellow reflects increases.
Figure 3.
Figure 3.
p value map for the area–thickness, area–volume, and thickness–volume relationships. Blue-cyan reflects a negative relationship, in which a relatively large decrease on one measure is associated with a relatively small decrease on the other measure. Red-yellow reflects a positive relationship, where a relatively large decrease in one measure is associated with a relatively large decrease in the other measure. Only effects that survived FDR correction for multiple comparisons at the 0.05 level are displayed.
Figure 4.
Figure 4.
A–C, Scatter plots with added linear best fit line, showing the relationships between annual percentage change (APC) in volume and thickness (A), volume and area (B), and thickness and area (C), respectively, in the superior parietal cortex.
Figure 5.
Figure 5.
Cortical regions (clusters) showing evidence of nonconstant levels of atrophy (area, thickness, volume) across age, following correction for multiple comparisons using cluster size correction by means of Monte Carlo simulations (p values displayed). Red-yellow reflects deceleration of atrophy with increasing age and blue-cyan reflects acceleration of atrophy with increasing age.
Figure 6.
Figure 6.
Spaghetti plots of area (mm2), thickness (mm), and volume (mm3) for cerebral cortex and selected lateral cortical regions. Average values of left and right hemisphere are displayed. For each region, an assumption-free general additive model as a function of age was fitted to accurately describe changes across the studied age range. Males are represented by blue lines, females by red lines.
Figure 7.
Figure 7.
Spaghetti plots of area (mm2), thickness (mm), and volume (mm3) for selected medial cortical regions. Average values of left and right hemisphere are displayed. For each region, an assumption-free general additive model as a function of age was fitted to accurately describe changes across the studied age range. Males are represented by blue lines, females by red lines.
Figure 8.
Figure 8.
Spaghetti plots of area (mm2), thickness (mm), and volume (mm3) for selected frontal cortical regions. Average values of left and right hemisphere are displayed. For each region, an assumption-free general additive model as a function of age was fitted to accurately describe changes across the studied age range. Males are represented by blue lines, females by red lines.

References

    1. Beck AT, Steer R. Beck depression inventory scoring manual. New York: Psychological; 1987.
    1. Bhardwaj RD, Curtis MA, Spalding KL, Buchholz BA, Fink D, Björk-Eriksson T, Nordborg C, Gage FH, Druid H, Eriksson PS, Frisén J. Neocortical neurogenesis in humans is restricted to development. Proc Natl Acad Sci U S A. 2006;103:12564–12568. doi: 10.1073/pnas.0605177103. - DOI - PMC - PubMed
    1. Buckner RL, Andrews-Hanna JR, Schacter DL. The brain's default network: anatomy, function, and relevance to disease. Ann N Y Acad Sci. 2008;1124:1–38. doi: 10.1196/annals.1440.011. - DOI - PubMed
    1. Dale AM, Fischl B, Sereno MI. Cortical surface-based analysis. I. Segmentation and surface reconstruction. Neuroimage. 1999;9:179–194. doi: 10.1006/nimg.1998.0395. - DOI - PubMed
    1. Delis DC, Kramer JH, Kaplan E, Ober BA. California verbal learning test—second edition (CVLT–II) San Antonio, TX: Psychological; 2000.

Publication types

LinkOut - more resources