. 2014 Jun 18;34(25):8546-56.
doi: 10.1523/JNEUROSCI.5002-13.2014.

Neurodegeneration by activation of the microglial complement-phagosome pathway

Affiliations

Neurodegeneration by activation of the microglial complement-phagosome pathway

Liviu-Gabriel Bodea et al. J Neurosci. .

Abstract

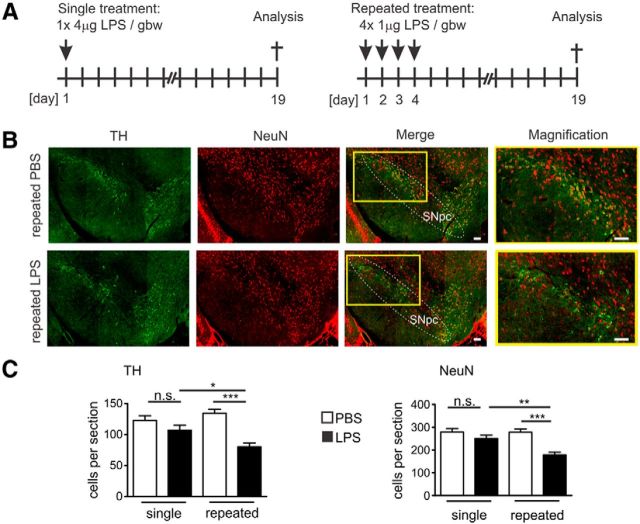
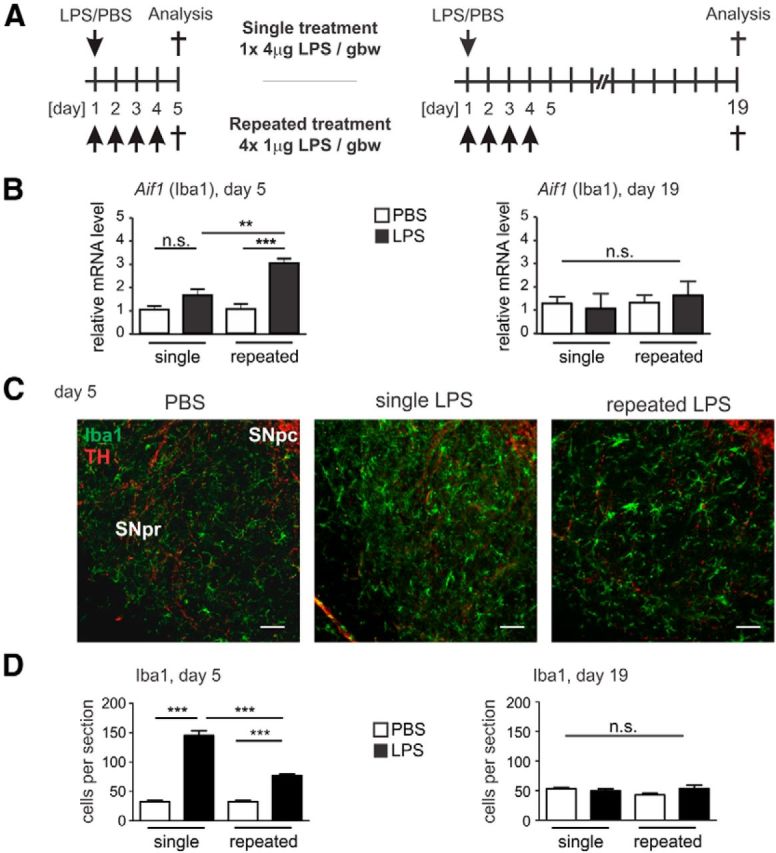
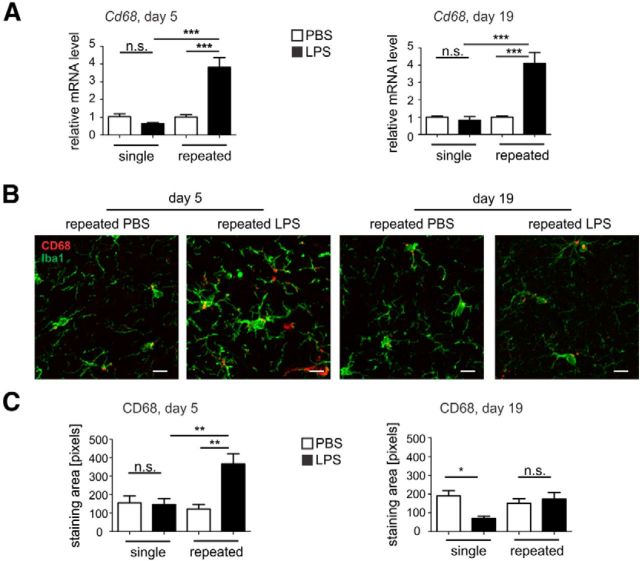
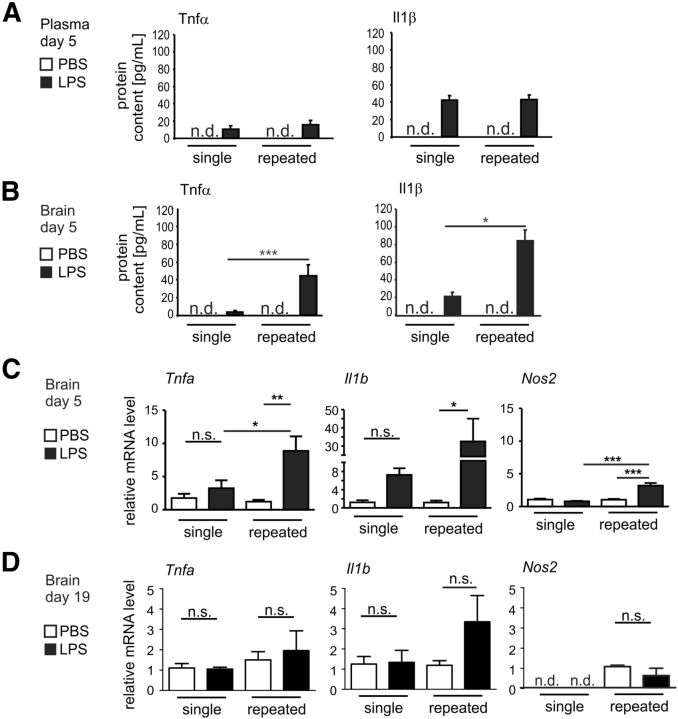
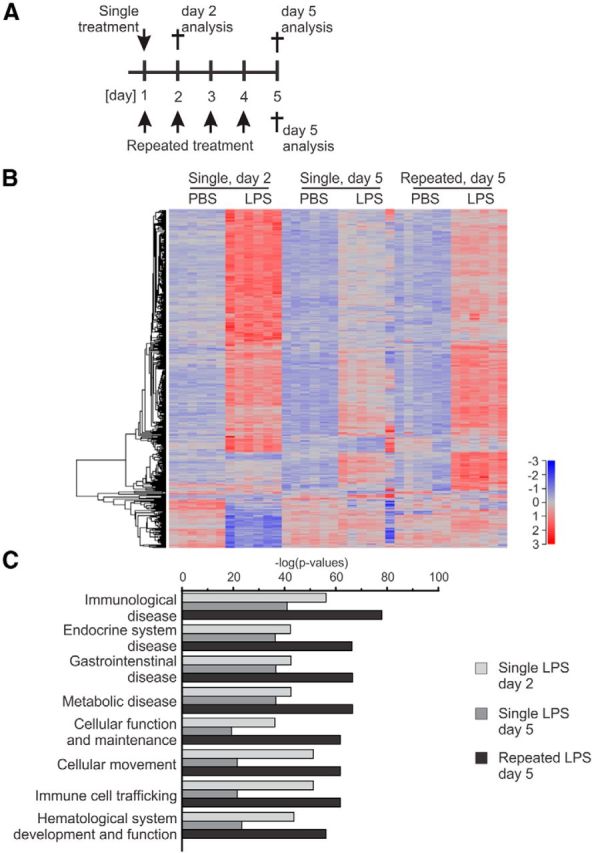
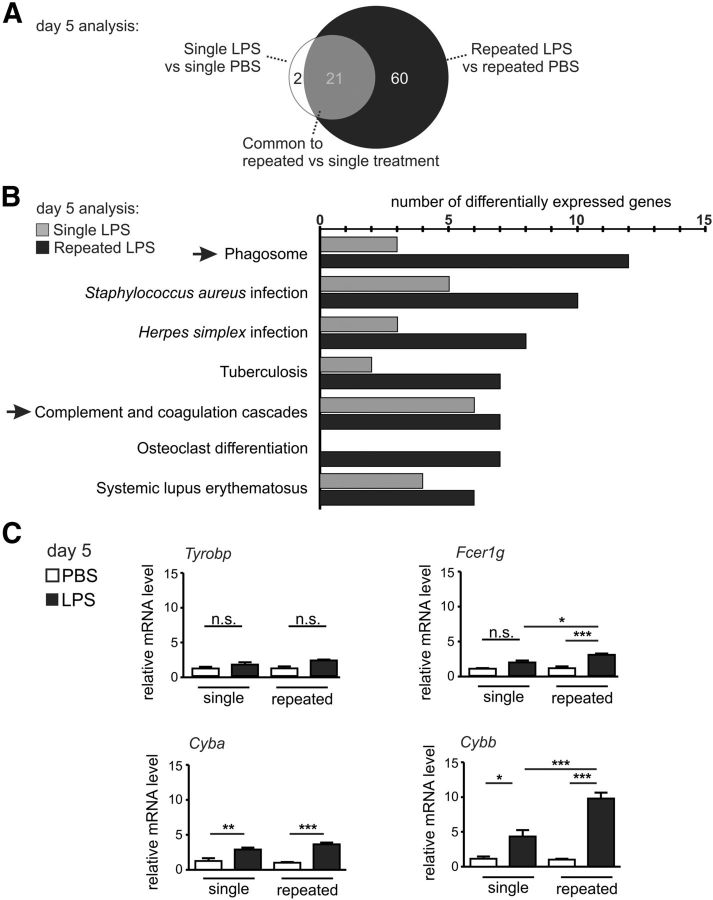
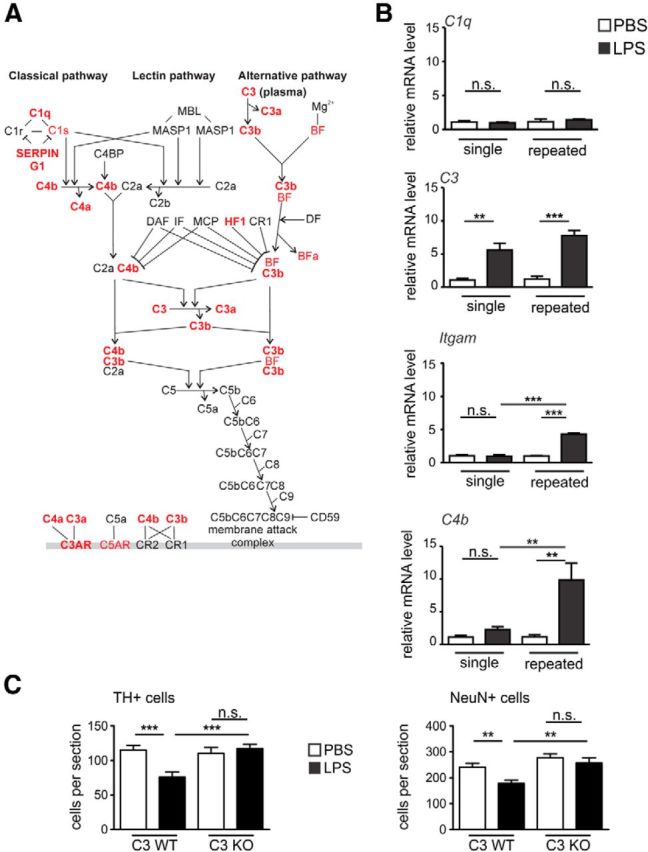
Systemic inflammatory reactions have been postulated to exacerbate neurodegenerative diseases via microglial activation. We now demonstrate in vivo that repeated systemic challenge of mice over four consecutive days with bacterial LPS maintained an elevated microglial inflammatory phenotype and induced loss of dopaminergic neurons in the substantia nigra. The same total cumulative LPS dose given within a single application did not induce neurodegeneration. Whole-genome transcriptome analysis of the brain demonstrated that repeated systemic LPS application induced an activation pattern involving the classical complement system and its associated phagosome pathway. Loss of dopaminergic neurons induced by repeated systemic LPS application was rescued in complement C3-deficient mice, confirming the involvement of the complement system in neurodegeneration. Our data demonstrate that a phagosomal inflammatory response of microglia is leading to complement-mediated loss of dopaminergic neurons.

Keywords: complement; microglia; neurodegeneration; neuroinflammation; phagosome; transcriptome.


Figures

Figure 1.
Figure 1.
Loss of dopaminergic neurons in the SN after repeated systemic challenges with LPS. A, Treatment and analysis paradigms. For the single treatment (left), mice were injected intraperitoneally once with 4 μg LPS/gbw and were analyzed on day 19. For the repeated treatment (right), mice were injected intraperitoneally on four consecutive days with 1 μg LPS/gbw and were analyzed on day 19. B, Immunofluorescence staining of the SN with antibodies directed against the dopaminergic cell specific marker protein TH (green) and neuronal nuclei marker protein NeuN (red) on experimental day 19 after repeated treatment with PBS control or LPS. Reduced staining of TH was detected in the SNpc after repeated systemic LPS challenge. Higher-magnification inset as indicated. Scale bar, 50 μm. Representative images for n ≥ 3 mice shown. C, Quantification of TH-positive (left) and NeuN-positive cells (right) in the SNpc of mice on experimental day 19 after systemic single or repeated challenge with PBS control or LPS. Only systemic repeated LPS application induced significant loss of TH-positive and NeuN-positive neurons. n ≥ 3 mice. n.s., Not significant. *p < 0.05. **p < 0.01. ***p < 0.001.
Figure 2.
Figure 2.
Prolonged microglial activation after repeated systemic challenge with LPS. A, Mice treatment and analysis paradigms. For the single treatment, mice were intraperitoneally injected once with 4 μg LPS/gbw and were analyzed on experimental day 5 or 19 (top). For the repeated treatment, mice were injected intraperitoneally on four consecutive days with 1 μg LPS/gbw and were analyzed on experimental day 5 or 19 (bottom). B, sqRT-PCR determination of Allograft inflammatory factor 1 (Aif1, the microglial marker ionized calcium binding adaptor molecule 1 [Iba1] encoding gene) from the whole brain of mice on experimental day 5 or 19 after single or repeated treatment with PBS control or LPS. Aif1 gene transcripts were increased on day 5 only after repeated application of LPS, and the transcript levels returned to the levels of PBS treatments control on day 19. n ≥ 3 mice. n.s., Not significant. **p < 0.01. ***p < 0.001. C, Immunofluorescence staining of the microglial marker Iba1 (green) in SNpr on experimental day 5 after single or repeated treatment with PBS control or LPS. TH immunostaining (red) was used to match the level of analysis. Microglial Iba1 immunoreactivity was highly increased after single and repeated LPS application. Scale bar, 50 μm. Representative images of n ≥ 3 mice shown. D, Quantification of Iba1 immunostaining in the SNpr sections of mice on experimental day 5 and 19 after single or repeated PBS control or LPS treatment. Microglial Iba1 immunoreactivity was increased on day 5 after both single and repeated systemic LPS challenge and returned to PBS control levels on day 19. n ≥ 3 mice. ***p < 0.001.
Figure 3.
Figure 3.
Enhanced microglial activation after repeated treatment with LPS. A, Microglial activation marker CD68 mRNA levels in the whole brain of mice on experimental day 5 or 19 after single or repeated treatment with PBS control or LPS. Cd68 gene transcripts were increased on both experimental days after repeated treatment with LPS. n ≥ 3 mice, n.s., Not significant. ***p < 0.001. B, Immunofluorescence staining of CD68 (red) and Iba1 (green) in SNpr on experimental day 5 or 19 after repeated treatment with PBS control or LPS. CD68 immunoreactivity was increased after repeated LPS application on day 5. Scale bar, 10 μm. Representative images of n ≥ 3 mice are shown. C, Quantification of CD68 immunoreactivity area in the SNpr sections of mice on experimental day 5 and 19 after single or repeated PBS control or LPS treatment. Microglial CD68 immunoreactivity was increased on day 5 after repeated systemic LPS challenge. n ≥ 3 mice. n.s., Not significant. *p < 0.05. **p < 0.01.
Figure 4.
Figure 4.
Increased production of proinflammatory cytokines in the brain after repeated systemic challenge with LPS. A, ELISA measurement of TNFα and IL1β proteins in the plasma of mice on experimental day 5 of single or repeated treatment with PBS control or LPS. Plasma levels of the cytokines showed similar response to LPS after single or repeated treatment. n.d., Not detected. B, ELISA measurement of TNFα and IL1β proteins in brains of mice on experimental day 5 of single or repeated treatment with PBS control or LPS. LPS challenge induced more pronounced elevation in the levels of the TNFα and IL1β after repeated treatment. n.d., Not detected. *p < 0.05. ***p < 0.001. C, sqRT-PCR for TNFa (gene transcript for TNFα protein), IL1b (gene transcripts for IL1β), and Nos2 (gene transcript for inducible nitric oxide synthase) in the whole brain of mice on experimental day 5 after single or repeated treatment with PBS control or LPS. The repeated LPS treatment induced increased transcription levels of TNFa, IL1b, and Nos2. n.s., Not significant. *p < 0.05. **p < 0.01. ***p < 0.001. D, sqRT-PCR for TNFa, IL1b, and Nos2 in the whole brain of mice on experimental day 19 after single or repeated intraperitoneal treatment with PBS control or LPS. The analyzed transcript levels were unchanged after single or repeated LPS challenge compared with the control. n.s., Not significant.
Figure 5.
Figure 5.
Enriched inflammatory response pathways in the brain after systemic repeated treatment with LPS. A, Treatment and analysis paradigms. For the single treatment (top), mice were injected intraperitoneally once with 4 μg LPS/gbw and were analyzed on experimental day 2 or 5. For the repeated treatment (bottom), mice were injected intraperitoneally on four consecutive days with 1 μg LPS/gbw and were analyzed on day 5. B, Heatmap of the transcriptome in mice after intraperitoneal treatments with LPS versus PBS on experimental day 2 and 5 (single treatment) or on day 5 only (repeated treatment); n > 3 mice. LPS treatment generates an increase of DE genes after both the single or repeated treatment. C, Enriched pathways of the DE genes of mice after intraperitoneal treatments with LPS versus PBS on experimental day 2 and 5 (single treatment) or only on day 5 (repeated treatment). Ingenuity Pathway Analysis was performed on significantly DE genes (FDR < 0.01) in each condition, and the top 12 enriched functions were presented. Score is obtained from the −log(p value) transformation; n > 3 mice.
Figure 6.
Figure 6.
The phagosome pathway is activated in the brain after systemic repeated LPS application. A, Venn diagram of the DE genes (FDR < 0.05, FC ≥ 2) in mice after single or repeated intraperitoneal treatments with LPS versus PBS on experimental day 5. Apart from a common group of 21 DE genes, 2 genes are specific to the single LPS treatment, whereas after the repeated challenges, 60 specific DE genes can be observed; n > 6 mice. B, KEGG pathway analysis of the DE microarray elements (FC > 2, FDR < 0.05) in the whole brain after single or repeated LPS challenge on day 5. By comparing the pathways formed by the 81 genes upregulated after the repeated LPS treatment with the pathways of the 23 genes upregulated by the single LPS treatment, the phagosome process shows the most selectively represented pathway in the repeated LPS challenge (12 genes from the repeated treatments and 3 genes from the single treatment). Microorganism response-related pathways were also enriched in the brain after repeated LPS challenge. Additionally, the complement and coagulation cascade were found to be enriched in the brain after repeated treatments (7 genes) and single treatment (6 genes); n > 3 mice. C, Gene transcript levels of elements involved in phagocytosis or phagocytosis-related oxidative stress analyzed via sqRT-PCR in mouse brain on day 5 of the single or repeated treatment paradigm. The genes of adaptor molecules implicated in phagocytosis Tyrobp (encoding DAP12) and Fcer1 g (common γ chain) were analyzed, with Fcer1 g being significantly upregulated by the repeated LPS challenges. NADPH oxidase components Cyba (transcript for p22phox protein) and Cybb (gp91) mRNA levels were upregulated by the single and even higher by the repeated LPS treatment. n > 3 mice. n.s., Not significant. *p < 0.05. **p < 0.01. ***p < 0.001.
Figure 7.
Figure 7.
The complement pathway is activated and involved in neurodegeneration after repeated LPS application. A, The complement system canonical pathway of mice after single or repeated intraperitoneal treatments with LPS versus PBS on experimental day 5 shows DE genes. Ingenuity Pathway Analysis was performed on significantly DE genes (FDR < 0.01) in each condition (single and repeated LPS treatment). The canonical complement pathway showed significance in both conditions (p < 1E−06). The overlay represented corresponds to repeated treatment, and significant upregulated genes are shown in red; n > 3 mice. B, Gene transcript levels of complement pathway analyzed via sqRT-PCR in mouse brain on day 5 of the single or repeated treatment paradigm. The classical pathway initiator C1q is unresponsive to the LPS challenge. C3 is upregulated by both single and repeated LPS treatment. Itgam (complement receptor 3 [CR3]) and C4 transcripts are significantly upregulated only by the repeated treatment with LPS. n > 3 mice. n.s., Not significant. **p < 0.01. ***p < 0.001. C, Quantification of TH-positive and NeuN-positive cells in the SNpc of C3-deficient (C3 KO) or wild-type (C3 WT) mice challenged repeatedly with PBS vehicle or LPS. The C3 KO mice showed no loss of TH-positive or NeuN-positive neurons compared with C3 WT animals; n ≥ 3 mice. n.s., Not significant. **p < 0.01. ***p < 0.001.

References

    1. Baquet ZC, Williams D, Brody J, Smeyne RJ. A comparison of model-based (2D) and design-based (3D) stereological methods for estimating cell number in the substantia nigra pars compacta (SNpc) of the C57BL/6J mouse. Neuroscience. 2009;161:1082–1090. doi: 10.1016/j.neuroscience.2009.04.031. - DOI - PMC - PubMed
    1. Benjamini Y, Hochberg T. Controlling the false discovery rate: a practical and powerful approach to multiple testing. J R Stat Soc. 1995;57:289–300.
    1. Block ML, Zecca L, Hong JS. Microglia-mediated neurotoxicity: uncovering the molecular mechanisms. Nat Rev Neurosci. 2007;8:57–69. doi: 10.1038/nrn2038. - DOI - PubMed
    1. Brown GC, Neher JJ. Eaten alive! Cell death by primary phagocytosis: “phagoptosis.”. Trends Biochem Sci. 2012;37:325–332. doi: 10.1016/j.tibs.2012.05.002. - DOI - PubMed
    1. Brown GC, Neher JJ. Microglial phagocytosis of live neurons. Nat Rev Neurosci. 2014;15:209–216. doi: 10.1038/nrn3710. - DOI - PubMed

Publication types