

Yield of Contrast-Enhanced Power Doppler Endoscopic Ultrasonography and Strain Ratio Obtained by EUS-Elastography in the Diagnosis of Focal Pancreatic Solid Lesions
- PMID: 24949352
- PMCID: PMC4062225
- DOI: 10.7178/eus.03.005
Yield of Contrast-Enhanced Power Doppler Endoscopic Ultrasonography and Strain Ratio Obtained by EUS-Elastography in the Diagnosis of Focal Pancreatic Solid Lesions
Abstract
Objective: Although endoscopic ultrasonography-guided fine needle aspiration (EUS-FNA) is the gold standard for diagnosing pancreatic lesions, its negative predictive value is suboptimal. Our aim was to evaluate the yield of contrast-enhanced EUS (CED-EUS) and of strain ratio EUS-elastography (SR-E-EUS) for differentiating pancreatic solid lesions.
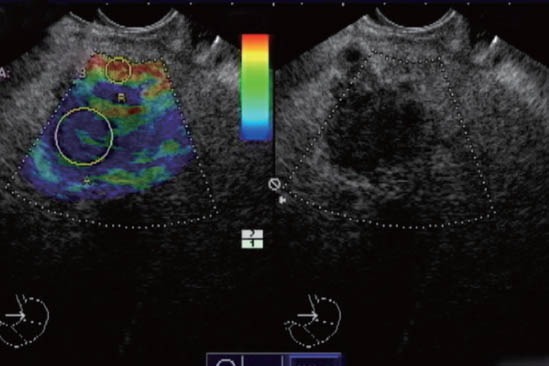
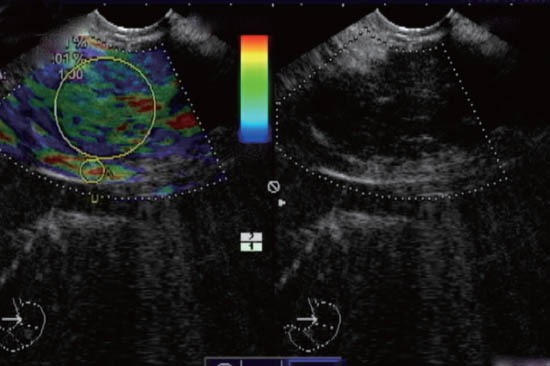
Methods: Forty-seven patients (27 men, 20 women, 70 ± 11 years) were consecutively involved in this single-center, prospective study. They were submitted to EUS, SR-E-EUS, CED-EUS with Sonovue(®), and EUS-FNA. The final diagnosis was based on the histological assessment of EUS-FNA and/or surgical specimens when available, and on follow-up of at least 6 months.
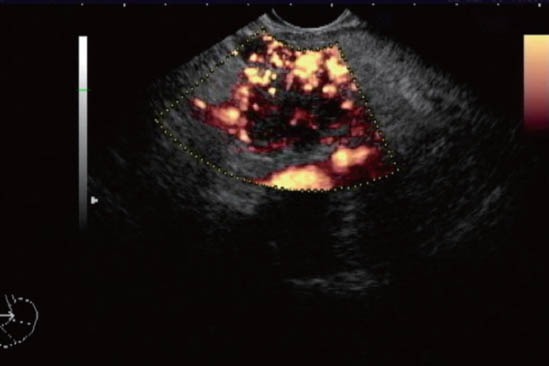
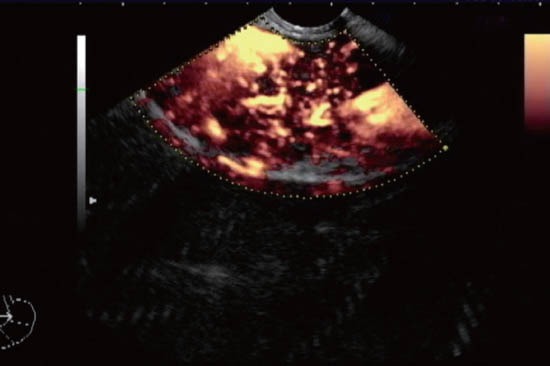
Results: From the 47 focal pancreatic lesions included, 13 (28%) were benign and 34 (72%) malignant. Patients with malignancy were older (70 ± 11 vs. 61 ± 8, P = 0.003), and had larger lesions (34 ± 12 mm vs. 22 ± 11 mm, P = 0.03). Malignant lesions had higher SR-E-EUS (31 ± 32 vs. 8 ± 9, P = 0.001) and more hypovascular pattern (93% vs. 33%, P < 0.001). Logistic regression determined that only hypovascularity (OR = 2.6, 95%CI: 1.5-130, P = 0.02) was independently predictive of malignancy. ROC analysis for SR-E-EUS yielded an optimal cutoff of 8 (AUC 0.91, 95%CI: 0.74-0.98) for the best power distinction for malignancy. There was no significant difference concerning sensitivity (79%, 90%, 93%) and specificity rates (85%, 75%, 67%) of EUS-FNA, SR-E-EUS, and CED-EUS, respectively. By analysis of the inconclusive EUS-FNA subset (9 patients, 19%), SR-E-EUS > 8 and hypovascularity showed sensitivity of 80% and 100%, and specificity of 67% and 67%, respectively.
Conclusion: The clinical utility of CED-EUS and SR-E-EUS remains questionable. The accuracies of CED-EUS and SR-E-EUS are similar to EUS-FNA. Hypovascularity was independently predictive of malignancy. Patients with inconclusive EUS-FNA could benefit from CED-EUS due to the high sensitivity of hypovascularity for diagnosing malignancy.
Keywords: contrast enhanced ultrasound; elastography; endoscopic ultrasound; endosonography; fine needle aspiration; pancreatic neoplasms.
Figures

References
-
- Giovannini M, Seitz JF, Monges G, et al. Fine needle aspiration citology guided by endoscopic ultrasonography: results in 141 patientes. Endoscopy. 1995;27:171–7. - PubMed
-
- Raut CP, Grau AM, Staerkel GA, et al. Diagnostic accuracy of endoscopic ultrasound-guided fine-needle aspiration in patients with presumed pancreatic cancer. J Gastrointest Surg. 2003;7:118–26. - PubMed
-
- Hirooka Y, Goto H, Ito A, et al. Contrast-enhanced endoscopic ultrasonography in pancreatic diseases: a preliminary study. Am J Gastroenterol. 1998;93:632–5. - PubMed
-
- Becker D, Strobel D, Bernatik T, et al. Echo-enhanced color-and power-Doppler EUS for the discrimination between focal pancreatitis and pancreatic carcinoma. Gastrointest Endosc. 2001;53:784–9. - PubMed
LinkOut - more resources
Full Text Sources
Research Materials