. 2014 Jun;49(3):950-70.
doi: 10.1111/1475-6773.12128.

Equity in access to health care services in Italy

Equity in access to health care services in Italy

Valeria Glorioso et al. Health Serv Res. 2014 Jun.

Abstract

Objective: To provide new evidence on whether and how patterns of health care utilization deviate from horizontal equity in a country with a universal and egalitarian public health care system: Italy.

Data sources: Secondary analysis of data from the Health Conditions and Health Care Utilization Survey 2005, conducted by the Italian National Institute of Statistics on a probability sample of the noninstitutionalized Italian population.

Study design: Using multilevel logistic regression, we investigated how the probability of utilizing five health care services varies among individuals with equal health status but different SES.

Data collection/extraction: Respondents aged 18 or older at the interview time (n = 103,651).

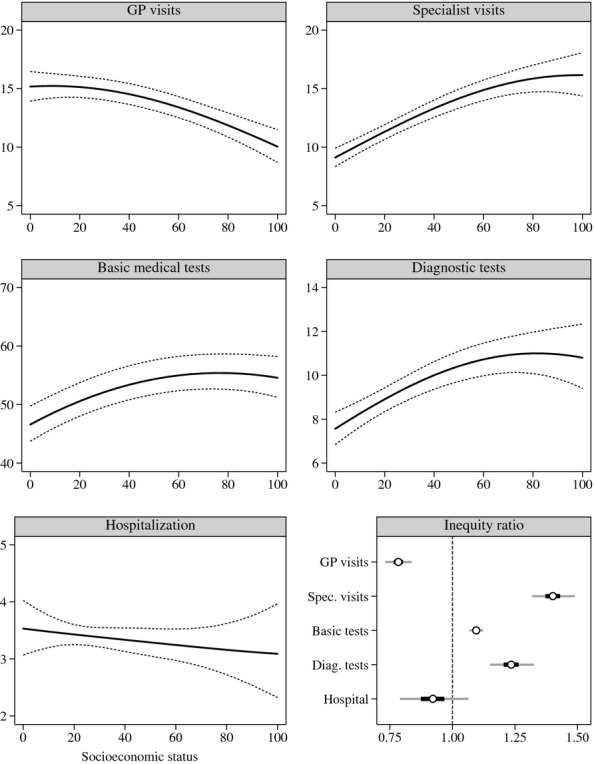
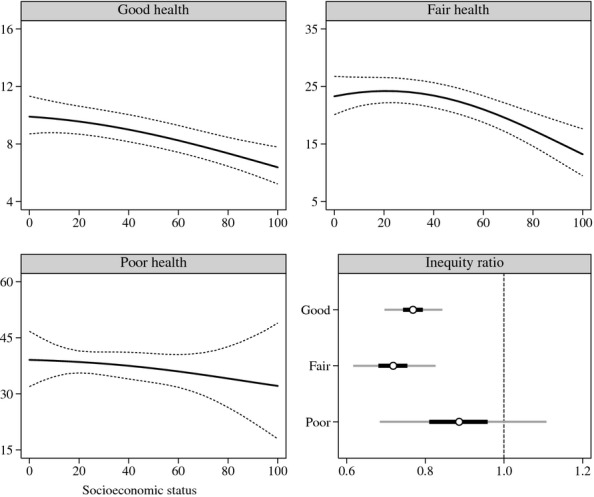
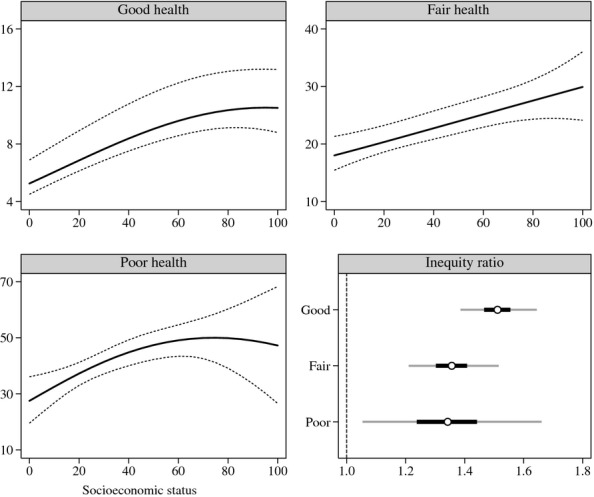
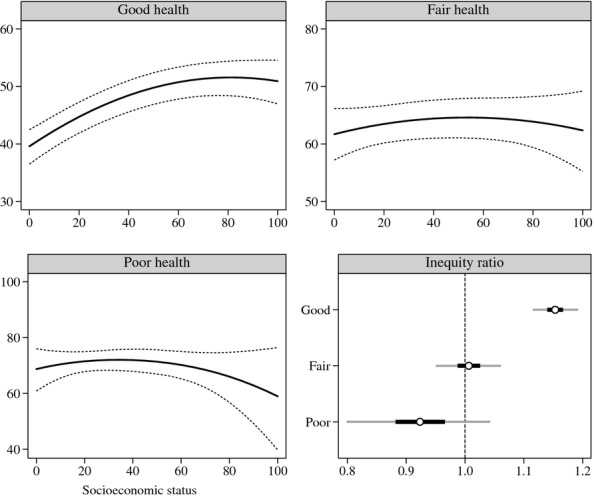
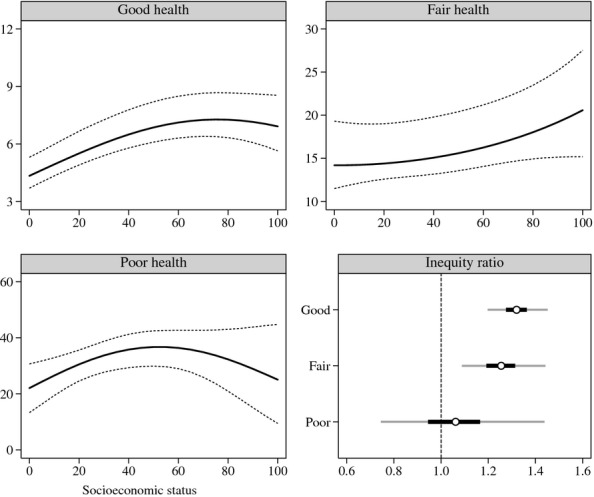
Principal findings: Overall, we found that use of primary care is inequitable in favor of the less well-off, hospitalization is equitable, and use of outpatient specialist care, basic medical tests, and diagnostic services is inequitable in favor of the well-off. Stratifying the analysis by health status, however, we found that the degree of inequity varies according to health status.

Conclusions: Despite its universal and egalitarian public health care system, Italy exhibits a significant degree of SES-related horizontal inequity in health services utilization.


Figures

Figure 1
Figure 1
Global Analysis—For Each Health Care Service, the Figure Displays (a) the Marginal Median Predicted Probability (percent) of Utilization by SES: Point Estimates (Solid Lines) and 95 percent Confidence Limits (Dashed Lines); and (b) the Inequity Ratio: Point Estimate (White Circle), 50 percent Confidence Limits (Dark Gray Line), and 95 percent Confidence Limits (Light Gray Line)
Figure 2
Figure 2
Stratified Analysis of GP Visits—For Each Level of Health Status, the Figure Displays (a) the Marginal Median Predicted Probability (percent) of Utilization by SES: Point Estimates (Solid Lines) and 95 percent Confidence Limits (Dashed Lines); and (b) the Inequity Ratio: Point Estimate (White Circle), 50 percent Confidence Limits (Dark Gray Line), and 95 percent Confidence Limits (Light Gray Line)
Figure 3
Figure 3
Stratified Analysis of Outpatient Specialist Visits—For Each Level of Health Status, the Figure Displays (a) the Marginal Median Predicted Probability (percent) of Utilization by SES: Point Estimates (Solid Lines) and 95 percent Confidence Limits (Dashed Lines); and (b) the Inequity Ratio: Point Estimate (White Circle), 50 percent Confidence Limits (Dark Gray Line), and 95 percent Confidence Limits (Light Gray Line)
Figure 4
Figure 4
Stratified Analysis of Basic Medical Tests—For Each Level of Health Status, the Figure Displays (a) the Marginal Median Predicted Probability (percent) of Utilization by SES: Point Estimates (Solid Lines) and 95 percent Confidence Limits (Dashed Lines); and (b) the Inequity Ratio: Point Estimate (White Circle), 50 percent Confidence Limits (Dark Gray Line), and 95 percent Confidence Limits (Light Gray Line)
Figure 5
Figure 5
Stratified Analysis of Outpatient Diagnostic Tests—For Each Level of Health Status, the Figure Displays (a) the Marginal Median Predicted Probability (percent) of Utilization by SES: Point Estimates (Solid Lines) and 95 percent Confidence Limits (Dashed Lines); and (b) the Inequity Ratio: Point Estimate (White Circle), 50 percent Confidence Limits (Dark Gray Line), and 95 percent Confidence Limits (Light Gray Line)

References

    1. Aday LA, Andersen RM. A Framework for the Study of Access to Medical Care. Health Services Research. 1974;9(3):208–20. - PMC - PubMed
    1. Aday LA, Andersen RM. Development of Indices of Access to Medical Care. Ann Arbor, MI: Health Administration Press; 1975.
    1. Aday LA, Andersen RM. Equity of Access to Medical Care: A Conceptual and Empirical Overview. Medical Care. 1981;19(12 Suppl):4–27. - PubMed
    1. Allin S, Hernández-Quevedo C, Masseria C. Measuring Equity of Access to Health Care. In: Smith PC, Mossialos E, Papanicolas I, Leatherman S, editors. Performance Measurement for Health System Improvement: Experiences, Challenges and Prospects. Cambridge, UK: Cambridge University Press; 2009. pp. 187–221.
    1. Allin S, Masseria C, Mossialos E. Measuring Socioeconomic Differences in Use of Health Care Services by Wealth versus by Income. American Journal of Public Health. 2009;99(10):1849–55. - PMC - PubMed

LinkOut - more resources