. 2014 Oct;57(5):1883-95.
doi: 10.1044/2014_JSLHR-L-13-0228.

Dialect awareness and lexical comprehension of mainstream american english in african american english-speaking children

Dialect awareness and lexical comprehension of mainstream american english in african american english-speaking children

Jan Edwards et al. J Speech Lang Hear Res. 2014 Oct.

Abstract

Purpose: This study was designed to examine the relationships among minority dialect use, language ability, and young African American English (AAE)-speaking children's understanding and awareness of Mainstream American English (MAE).

Method: Eighty-three 4- to 8-year-old AAE-speaking children participated in 2 experimental tasks. One task evaluated their awareness of differences between MAE and AAE, whereas the other task evaluated their lexical comprehension of MAE in contexts that were ambiguous in AAE but unambiguous in MAE. Receptive and expressive vocabulary, receptive syntax, and dialect density were also assessed.

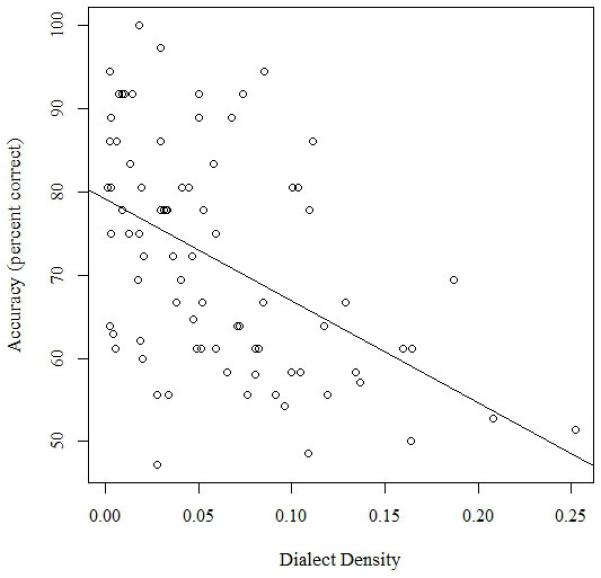
Results: The results of a series of mixed-effect models showed that children with larger expressive vocabularies performed better on both experimental tasks, relative to children with smaller expressive vocabularies. Dialect density was a significant predictor only of MAE lexical comprehension; children with higher levels of dialect density were less accurate on this task.

Conclusions: Both vocabulary size and dialect density independently influenced MAE lexical comprehension. The results suggest that children with high levels of nonmainstream dialect use have more difficulty understanding words in MAE, at least in challenging contexts, and suggest directions for future research.


Figures

Figure 1
Figure 1
The top plot shows accuracy rate on the MAE lexical comprehension task plotted as a function of expressive vocabulary size (EVT-2 raw score), while the bottom plot shows accuracy rate plotted as a function of dialect density. Solid lines show model fit. (It should be noted that the model fits shown in this figure and subsequent figures similar but not identical to the models in Appendix B. In order to illustrate the cross-level interactions, the dependent variable in these models is average accuracy rate at the child level, while the dependent variable in the models of appendix B is accuracy at the trial level.)
Figure 1
Figure 1
The top plot shows accuracy rate on the MAE lexical comprehension task plotted as a function of expressive vocabulary size (EVT-2 raw score), while the bottom plot shows accuracy rate plotted as a function of dialect density. Solid lines show model fit. (It should be noted that the model fits shown in this figure and subsequent figures similar but not identical to the models in Appendix B. In order to illustrate the cross-level interactions, the dependent variable in these models is average accuracy rate at the child level, while the dependent variable in the models of appendix B is accuracy at the trial level.)
Figure 2
Figure 2
The top plot shows accuracy rate on the MAE lexical comprehension task plotted as a function of expressive vocabulary size (EVT-2 raw score) separated by contrast type. Gray circles show accuracy for the phonological contrast; black triangles show accuracy for the morphological contrast. The gray solid line shows model fit for phonological contrast; the black dotted line show model fit for morphological contrast. The bottom plot shows accuracy rate plotted as a function of dialect density separated by consonant number. Gray circles show accuracy for the singleton consonant condition; black triangles show accuracy for the consonant cluster condition. The gray solid line shows model fit for singleton consonant condition; the black dotted line shows model fit for consonant cluster condition.
Figure 2
Figure 2
The top plot shows accuracy rate on the MAE lexical comprehension task plotted as a function of expressive vocabulary size (EVT-2 raw score) separated by contrast type. Gray circles show accuracy for the phonological contrast; black triangles show accuracy for the morphological contrast. The gray solid line shows model fit for phonological contrast; the black dotted line show model fit for morphological contrast. The bottom plot shows accuracy rate plotted as a function of dialect density separated by consonant number. Gray circles show accuracy for the singleton consonant condition; black triangles show accuracy for the consonant cluster condition. The gray solid line shows model fit for singleton consonant condition; the black dotted line shows model fit for consonant cluster condition.

Similar articles

Cited by

References

    1. Bates D, Maechler M, Bolker B. lme4: Linear mixed-effects models using S4 classes. 2012 R package version 0.999999-0. http://CRAN-R-project.org/package=lme4.
    1. Boersma P. Praat, a system for doing phonetics by computer. Glot International. 2001;5:341–345.
    1. Carrow-Woolfolk E. Test of Auditory Comprehension of Language. 3rd edition Pro-Ed.; Austin: 1999.
    1. Catts HW, Fey ME, Zhang X, Tomblin JB. Language basis of reading and reading disabilities: Evidence from a longitudinal investigation. Scientific Studies of Reading. 1999;3:331–361.
    1. Chambers JK. Dialect acquisition. Language. 1992;68:673–705.

Publication types

LinkOut - more resources