. 2014 Jun;19(6):066007.
doi: 10.1117/1.JBO.19.6.066007.

Fourier ptychographic microscopy for filtration-based circulating tumor cell enumeration and analysis

Affiliations

Fourier ptychographic microscopy for filtration-based circulating tumor cell enumeration and analysis

Anthony Williams et al. J Biomed Opt. 2014 Jun.

Erratum in

Abstract

Circulating tumor cells (CTCs) are recognized as a candidate biomarker with strong prognostic and predictive potential in metastatic disease. Filtration-based enrichment technologies have been used for CTC characterization, and our group has previously developed a membrane microfilter device that demonstrates efficacy in model systems and clinical blood samples. However, uneven filtration surfaces make the use of standard microscopic techniques a difficult task, limiting the performance of automated imaging using commercially available technologies. Here, we report the use of Fourier ptychographic microscopy (FPM) to tackle this challenge. Employing this method, we were able to obtain high-resolution color images, including amplitude and phase, of the microfilter samples over large areas. FPM's ability to perform digital refocusing on complex images is particularly useful in this setting as, in contrast to other imaging platforms, we can focus samples on multiple focal planes within the same frame despite surface unevenness. In model systems, FPM demonstrates high image quality, efficiency, and consistency in detection of tumor cells when comparing corresponding microfilter samples to standard microscopy with high correlation (R² = 0.99932). Based on these results, we believe that FPM will have important implications for improved, high throughput, filtration-based CTC analysis, and, more generally, image analysis of uneven surfaces.


Figures

Fig. 1
Fig. 1
(a) The FPM setup consists of (from the bottom) an LED matrix for sample illumination, a microscope system with a 2× objective, and a camera connected to a computer. (b) The Fourier spectrum point of view. The center red subregion corresponds to the spatial frequency of the low-resolution image captured with plane waves with kx=ky=0. The off-center red subregion correlates to an oblique angle illumination with wavevector (kx,ky). (c) Light from an LED at an oblique angle corresponds to a plane wave with a k vector (kx,ky).
Fig. 2
Fig. 2
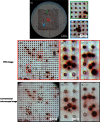
(a) Full field-of-view color image of the entire microfilter containing captured tumor cells by FPM. Magnified FPM images (b-d1) selected from different areas of the microfilter show detailed morphology of tumor cells, where all sections are well in focus because of the automatic EPRY-FPM program. (d2) A standard microscope (with 40× objective) image shows the corresponding region to (d1), but because of the uneven surface of the microfilter, subregions (d2-1) and (d2-2) cannot be focused simultaneously. Also, its field of view is limited when compared to (d2), as seen by the aperture’s outline at the edge of the image, in contrast to FPM’s wide field-of-view that can provide high-resolution images of the entire microfiltration area.
Fig. 3
Fig. 3
(a) A microfilter’s surface profile characterized by the pupil function recovered from EPRY-FPM algorithm. The focal plane of the objective is at 150 μm. The maximum difference in-depth across the filter is about 250 μm, which is within FPM’s refocusing capacity of 300 μm. In this case, the captured microfilter image is sectioned into 17×17 tiles, and EPRY-FPM iteratively characterizes each tile’s defocus level in its high-resolution image reconstruction process. (b1)-(c2) Small subregions are extracted from two different surface levels, showing before and after refocusing by EPRY-FPM. (b1) is already very close to the focal plane, so there is only a minor improvement after refocusing, as in (b2). (c1) is not in the focal plane and is blurry. (c2) shows the refocused result.
Fig. 4
Fig. 4
Graph demonstrating the correlation between tumor cell count by standard microscopy (y-axis) and tumor cell count by FPM (x-axis) in corresponding microfilter samples, where each data point represents a single trial with tumor cells enumerated by both methods.

Similar articles

Cited by

References

    1. Bidard F. C., et al. , “Prognosis of women with stage IV breast cancer depends on detection of CTC rather than disseminated tumor cells,” Ann. Oncol. 19, 496–500 (2007).ANONE210.1093/annonc/mdm507 - DOI - PubMed
    1. Cristofanilli M., et al. , “Circulating tumor cells, disease progression, and survival in metastatic breast cancer,” N. Engl. J. Med. 351 781–791 (2004).NEJMAG10.1056/NEJMoa040766 - DOI - PubMed
    1. Cristofanilli M., et al. , “Circulating tumor cells: a novel prognostic factor for newly diagnosed metastatic breast cancer,” J. Clin. Oncol. 23, 1420–1430 (2005).JCONDN10.1200/JCO.2005.08.140 - DOI - PubMed
    1. Danila D. C., et al. , “Circulating tumor cell number and prognosis in progressive castration-resistant prostate cancer,” Clin. Cancer Res. 13, 7053–7058 (2007).CCREF410.1158/1078-0432.CCR-07-1506 - DOI - PubMed
    1. Hayes D. F., et al. , “Circulating tumor cells at each follow-up time point during therapy of metastatic breast cancer patients predict progression-free and overall survival,” Clin. Cancer Res. 12, 4218–4224 (2006).CCREF410.1158/1078-0432.CCR-05-2821 - DOI - PubMed

Publication types